Facebook (NASDAQ:FB) just can’t get catch a break. But then maybe, at least according to some, they don't deserve to.
Even after years of being accused of user privacy abuses, along with a number of data breach scandals in which the social media behemoth was involved, CEO Mark Zuckerberg remains surprisingly sanguine, and unapologetic.
The latest black mark against the Menlo Park, California-based company comes from a lawsuit filed last week by 10 US states, alleging the company made a pact with Alphabet's Google (NASDAQ:GOOGL) in 2018, "in which Facebook agreed not to compete with Google’s online advertising tools in return for special treatment when it used them."
Now, Facebook is going after Apple (NASDAQ:AAPL), claiming they are doing so as a way of standing up for small business. Interesting timing, to say the least.
Zuckerberg is unhappy that Apple has given its users a choice to opt-out of having their online searches tracked, a common device used by internet companies to target their advertising.
Facebook's stance is based on a Deloitte study which found that on average, small business advertisers would lose more than 60% of their sales relative to their advertising investment without targeted placement. As well, Facebook claims that, while an opt-out feature will also hurt their revenue, they're really only standing up for small businesses that will be devastated by the move.
The Electronic Frontier Foundation, a non-profit digital rights group, “founded in response to a basic threat to speech and privacy," sides with Apple on this one, saying “Facebook's laughable campaign" is really anti-users and small businesses.
The antitrust lawsuit as well as what looks like a renewed wave of investor disgust at the company's latest, high profile but questionable tactics appear to be driving a selloff.

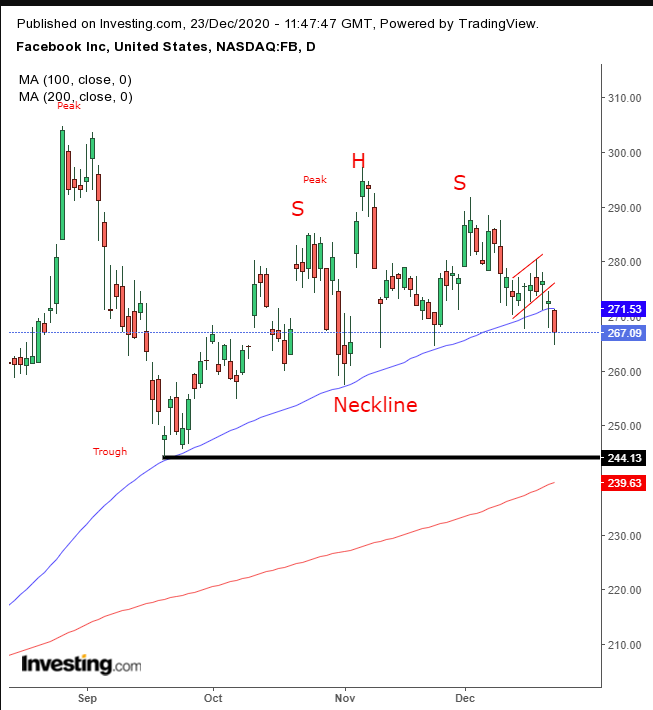
On Monday, Facebook dropped below its tight upward range, which formed a rising flag. That's bearish after the preceding 6% slump within four days, which also followed a range.
The flag provided the opportunity for new sellers to come in, skimming off demand created by earlier sellers. The downside breakout demonstrated that sellers would go lower to find buyers.
The trading range also gave bears the chance to regroup and extend an advance which took on yet another bearish stronghold—the 100 DMA—for the first time since crossing over it on Apr. 29. The moving average draws a natural neckline to a H&S continuation pattern, signaling that the 18% decline from the stock's Aug. 26 record to its Sept. 23 low had just staved off the 20% drop required to be able to say the stock had entered a bear market.
However, the pattern’s $28-dollar implied target brings the price face-to-face with the 200 DMA, showing us how the supply-demand forces worked in harmony, as the 100 DMA passed the ball to the 200 DMA.
The bigger MA can very well provide a support, which would be crucial, because if the price falls below the Sept. 21, $244.13 level, it will have established a downtrend, with a descending series of peaks and troughs.

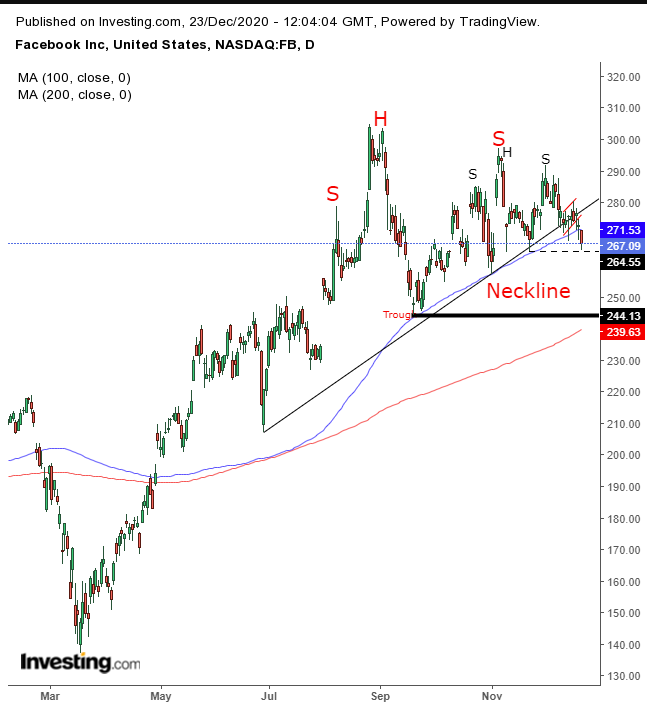
If the 200 DMA should no longer act as support, Facebook may complete a larger H&S top, from the June 29 low of $207.11.
Note how the long neckline of this larger, upsloping H&S tops' neckline fits perfectly with the current, smaller H&S continuation pattern, as the 100 DMA coils around it. This is how we identify the various technical pressure points and see how all the forces of supply and demand come together.
Note: the short-term trend is still up until the price falls below the Nov. 23 low of $264.55. The medium trend will turn down after falling below the Sept. 18 low of $244.13.
Trading Strategies
Conservative traders would wait for a new downtrend in the medium term, before attempting to short the stock.
Moderate traders are likely to short after the short-term trend is established.
Aggressive traders will short now, after having completed both a bearish flag and H&S, provided they understand and accept the risk of being whipsawed and have a considered plan they commit to.
Here’s an example:
Trade Sample
- Entry: $275
- Stop-Loss: $280
- Risk: $5
- Target: $245
- Reward: $30
- Risk:Reward Ratio: 1:6
