Expectations are that when U.S. initial jobless claims are reported today, chances are the release could receive more attention than it generally does—given the announcement is one of the few points of interest for markets on Boxing Day when many countries across the globe remain on holiday. Claims are expected to dip to 224K from 234K last week.
Since there's nothing more significant on the docket, we anticipate a dollar selloff afterward. This should create a buying dip.
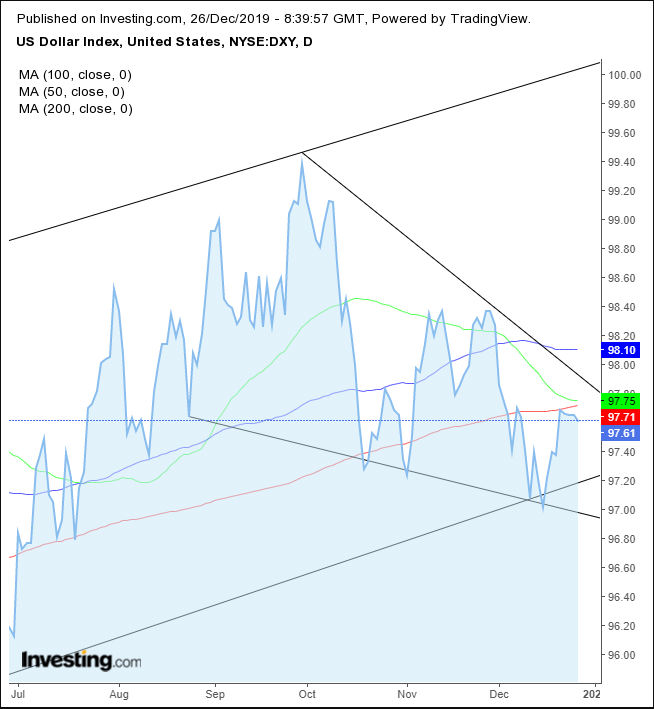
Indeed, recently the USD has been gaining on selling. As well, the global reserve currency is near the bottom of two patterns which makes its technicals look bullish as well.

The Dollar Index has been trading within a rising channel since August. The bottom of the channel is drawn with the uptrend line, where buyers—either short-term traders or USD bulls—come in to support the price. The top of the channel signifies the angle at which sellers overcome buying, by both profit-takers and bears.
The price already bounced off the bottom of the channel on Dec. 16, making it much more likely the scenario will be another rise toward the top of the channel, taking on the 99.50 Sept. 30 high.
At the same time, since August, the pattern has developed a falling wedge, whose peak is the very same September high, which is bullish within the rising channel. The pattern represents an interruption of the uptrend, wherein demand absorbs all the available supply within the pattern. An upside pattern signals a resumption of the overall uptrend, represented by the rising channel.
The 50 DMA dipped toward the 200 DMA but curved up before reaching it. The two moving averages are now the nearest to each other since the June golden cross that foretold the 8% jump to the 99.50 high, or to the 6% gain at the current level.
The risk-reward balance is expressed by the fact that while the 50 DMA might fall below the 200 DMA, triggering a death cross, and even fall below the rising channel—threatening a reversal—it could just as easily bounce off the 200 DMA for an explosive upmove. Based on the evidence, as described, we think the latter is the much more likely scenario.
Trading Strategies
Conservative traders should wait for a close above 98.50 to clear the previous peaks within the falling wedge, to demonstrate the pattern is complete; from this point forward prices will rise. However, they’d do well to first wait for a return move to retest the pattern’s now-expected support.
Moderate traders would wait for the upside breakout and the pullback, but not necessarily for confirmation of the trend, rather for a better entry.
Aggressive traders would buy the expected dip, if indeed jobless claims do come in lower—either because the numbers are smaller than expected, or in case even the anticipated dip has not been priced in.
Trade Sample
