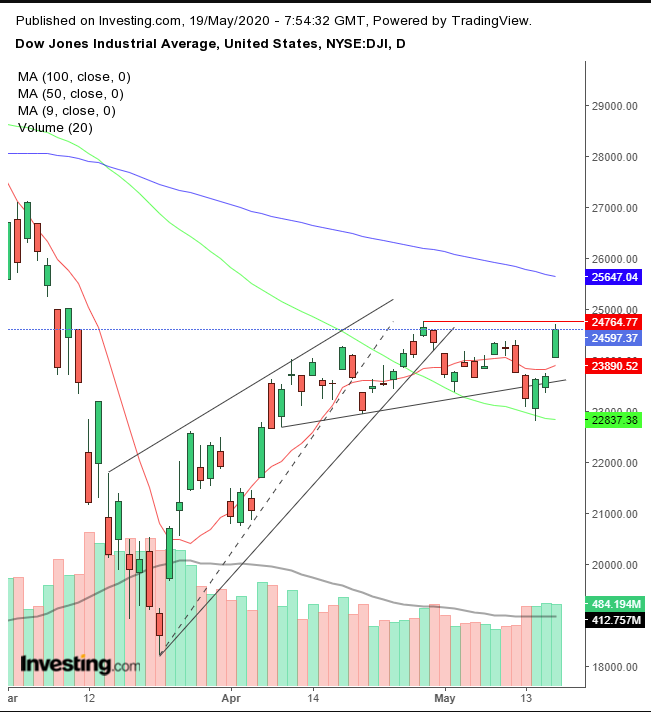
A trio of market drivers lined up yesterday, to produce the biggest advance for equities in six weeks. The Dow Jones Industrial Average rose over 900 points and gained almost 4%.
The three catalysts: a potential coronavirus vaccine; even more government stimulus; and the easing of lockdowns bringing about a return to business activity.
- Yesterday, Moderna (NASDAQ:MRNA), a Cambridge, MA-based biotech announced they'd had early, encouraging results with an experimental vaccine for COVID-19.
- After warning last week that the economy might remain sluggish for at least 18-months, Fed chief Jerome Powell turned more positive, saying the central bank is not out of ammunition “by a long shot."
- Reopening economies, both in the US and globally.
Together, the developments were able to whip US markets into a frenzy, driving them all higher. What does this mean for the trajectory of stocks? We don't know. Yet.
But we should point out that until now we've been pessimistic because of back-to-back bearish patterns. We're now about to second guess our earlier bearish calls. 
Why have we been bearish till now? First, we called a short-term uptrend, after the price completed an ascending series of peaks and troughs on April 7. Then, in late April, when traders failed to maintain the rate of advance, which would have eventually completed a rising wedge—a continuation pattern—we saw it as another bearish move. After all, it signaled a resumption of what was demonstrated as the underlying downtrend, after the 38% plunge from the February all-time high to the March low.
Finally, an immediate, second bearish pattern developed, from within the very first bearish pattern—a H&S top. The reversal pattern, which confirmed the bearish wedge, was completed on May 13 after it fell below the neckline, the trend line that connected the lows of what appeared to be a top.
The activity on May 14 extended that penetration, but only on an intraday basis. Prices rebounded on Thursday to close slightly back above the neckline.
That in itself is not necessarily significant, nor was Friday’s minute additional advance. The price was still on the neckline, suppressed by the 200 DMA, suggesting risk was to the downside. We did note, however, that high trading volume on both those days was a cause for concern, but we stuck to our bearish thesis, as price is paramount.
So why are we second-guessing our bearish call now? Monday’s surge, backed by volume, crossed above the 200 DMA, to the very top of the H&S, shaking up the supply-demand dynamics within.
We are concerned that traders may have unwound positions, leading to a short squeeze which could compel investors to add new, long positions—upending the bearish patterns developed thus far.
Such a blowout would reverse the course of supply and demand in the opposite direction, thereby producing another leg up.
Nonetheless, we're not ready to make a bullish call just yet. While the H&S has been invalidated, stocks would have to make a new high, to both blow out the larger, bearish wedge, as well as to dispel a potential double top.
A significant close above the psychological, round 25,000 level would convince us that the market structure had flipped, at which point we'd wholeheartedly make that positive call.
Trading Strategies
Conservative traders would wait on a long position for a minimum 3% penetration of the April 29 high, to above 25,500, followed by a return move to retest the new support of the pattern. Alternatively, conservative traders may enter a short position with a close below 22,130, employing the same filter to the downside, followed by a corrective rally to confirm the resistance in that scenario.
Moderate traders are likely to brave a long position with just a 2% upside move past the April 29 would-be top, to above 25,250; they could short with the same parameters below the May 14 low, below 22,345.
Aggressive traders might enter a contrarian, short position, betting on morbid economic data, Powell’s somber prediction of a lengthy recession (which occurred before he came back to cheerlead stock prices higher), and the long road ahead before a bona fide vaccine would be released and distributed. There is still the potential of a double-top and the completed rising wedge. However, these traders are the most disciplined. They never enter a trade half-cocked and are prepared to lose some of the time.
Trade Sample – Aggressive Short Position
- Entry: 24,700
- Stop-Loss: 25,000
- Risk: 300 points
- Target: 23,200
- Reward: 1,500 points
- Risk:Reward Ratio: 1:5
