Breaking News
Get 45% Off 0
🌊 NVIDIA ripple effect: Track AI stocks' response to chip giant's earnings
Explore AI Stocks

Chart Of The Day: Dollar's Complicated Dance Continues

By Investing.com (Pinchas Cohen)CurrenciesApr 19, 2021 09:33AM ET
www.investing.com/analysis/chart-of-the-day-dollars-complicated-dance-continues-200573864
Chart Of The Day: Dollar's Complicated Dance Continues
By Investing.com (Pinchas Cohen)   |  Apr 19, 2021 09:33AM ET
Saved. See Saved Items.
This article has already been saved in your Saved Items
 
 
DX
+0.13%
Add to/Remove from Watchlist
Add to Watchlist
Add Position

Position added successfully to:

Please name your holdings portfolio
 

Right now, the US dollar is languishing at a monthly low. That's because yields also fell in the same proportion over the same period.

Among other catalysts, the slump also comes courtesy of the Federal Reserve which has repeatedly said it will not raise rates. But investors are growing skeptical after the central bank first played down spiking yields as nothing more than faith in rising demand amid a reopening economy, ignoring the possibility of escalating inflation while vowing that rates will remain lower for longer even if the Fed's inflation targets are met.

Additionally, after a good run for the reflation trade in recent days, profit-taking was in order. Last week, value sectors such as Utilities (+3.7%) and Materials (+3%) led, while growth sectors Tech (+1.1%) and Communication Services (-0.1%) lagged.

As well, given that the reflation trade is based on rising inflation, it's becoming harder to deny that inflation itself isn't a market presence. After all, last week’s US consumer price releases indicated that CPI rose 0.6% for the month, 2.6% year-over-year.

That's the biggest jump for those metrics since 2008. While it does make a powerful case for vaulting inflation, traders would do well to keep things in proportion. First, those measures included a 23% spike in gas prices, which is why economists prefer the Core CPI metric, since it excludes volatile energy and food prices.

Second, the current measure of inflation is being compared to a period when the economy was shut down during the height of the pandemic. As such it doesn't necessarily represent a true comparative gauge for the immediate economic situation. Technicals are also signaling a complex story.
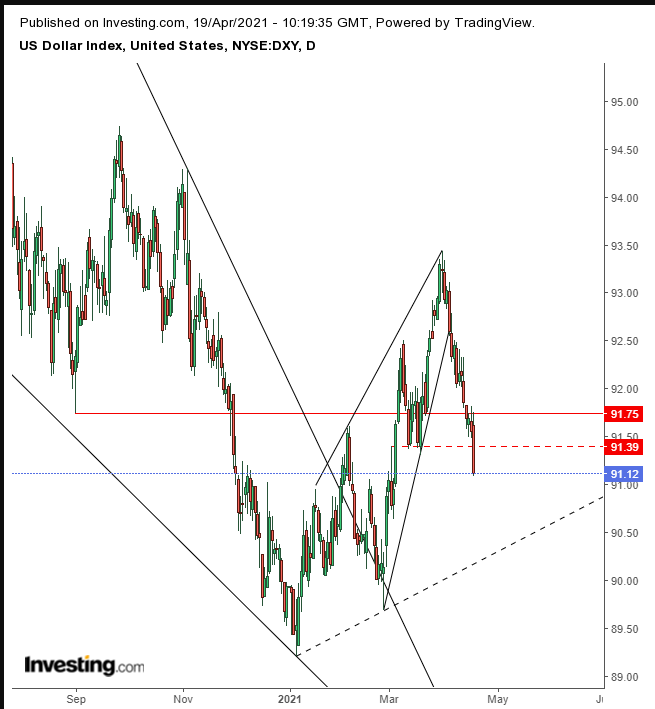
DXY Daily
DXY Daily

The dollar completed a rising wedge, bearish after the more than 5% plunge in the preceding two months between the Nov. 4 high and the Jan. 2 low. The wedge started off with both buyers and sellers agreeing that prices should go higher. However, sellers were less and less willing to let go of their supply with each dollar uptick, leaving buyers to continuously reduce their expectations, until the uptrend fizzled.

On the other hand, the price also completed an earlier, much larger wedge since the March peak. Thus, until the price doesn’t register below the Jan. 6 low, we expect the dollar to bounce and take out the Mar. 31 high. 

However, if the Jan. 6 low breaks, we'll return to our initial bearish stance

As we see it, trading is a kind of dance; the more precisely you learn the moves and understand your partner the more elegantly you can dance with them. Therefore, right now we're bearish on the greenback in the short-term, but remain bullish over the long-term.

The dollar could whipsaw in the short-term, stopping out poorly placed positions or those that are insufficiently funded. Here's the 'footing' we recommend for the USD dance right now:

Conservative traders should wait for the dollar to either confirm the first wedge since March or beak it, before entering a position.

Moderate traders would go long when the price rebounds off the (dotted) uptrend line connecting the Jan. 6 and Feb. 25 lows.

Aggressive traders could short in the near term, before joining the rest of the market in what we foresee would be another rally, provided they understand the risk of going against the main trend and of the dollar already moving so far away from the rising wedge completion, having already completed roughly two thirds of its implied target.

Therefore, use a trading plan that fits your style and stick to it. Here’s a basic example:

Trade Sample

  • Entry: 91.50
  • Stop-Loss: 91.75
  • Risk: 25 pips
  • Target: 90.00
  • Reward: 150 pips
  • Risk:Reward Ratio: 1:6

Author's Note: As the above title implies, this is just one sample of many possible approaches. Ultimately, you need to learn how to customize a plan to your budget, timing and temperament. Till then, we invite you to use ours, but for the purpose of learning purposes, not for profit, or you will end up doing neither.

Chart Of The Day: Dollar's Complicated Dance Continues
 

Related Articles

Andrey Goilov
USD/JPY Consolidates as Yen Strength Stalls Near Highs By Andrey Goilov - Feb 27, 2025

USD/JPY is consolidating near 149.33 on Wednesday, with the yen pausing its rally while holding near four-month highs against the USD. This stabilisation follows renewed support...

Chart Of The Day: Dollar's Complicated Dance Continues

Add a Comment

Comment Guidelines

We encourage you to use comments to engage with other users, share your perspective and ask questions of authors and each other. However, in order to maintain the high level of discourse we’ve all come to value and expect, please keep the following criteria in mind:  

  •            Enrich the conversation, don’t trash it.

  •           Stay focused and on track. Only post material that’s relevant to the topic being discussed. 

  •           Be respectful. Even negative opinions can be framed positively and diplomatically. Avoid profanity, slander or personal attacks directed at an author or another user. Racism, sexism and other forms of discrimination will not be tolerated.

  • Use standard writing style. Include punctuation and upper and lower cases. Comments that are written in all caps and contain excessive use of symbols will be removed.
  • NOTE: Spam and/or promotional messages and comments containing links will be removed. Phone numbers, email addresses, links to personal or business websites, Skype/Telegram/WhatsApp etc. addresses (including links to groups) will also be removed; self-promotional material or business-related solicitations or PR (ie, contact me for signals/advice etc.), and/or any other comment that contains personal contact specifcs or advertising will be removed as well. In addition, any of the above-mentioned violations may result in suspension of your account.
  • Doxxing. We do not allow any sharing of private or personal contact or other information about any individual or organization. This will result in immediate suspension of the commentor and his or her account.
  • Don’t monopolize the conversation. We appreciate passion and conviction, but we also strongly believe in giving everyone a chance to air their point of view. Therefore, in addition to civil interaction, we expect commenters to offer their opinions succinctly and thoughtfully, but not so repeatedly that others are annoyed or offended. If we receive complaints about individuals who take over a thread or forum, we reserve the right to ban them from the site, without recourse.
  • Only English comments will be allowed.
  • Any comment you publish, together with your investing.com profile, will be public on investing.com and may be indexed and available through third party search engines, such as Google.

Perpetrators of spam or abuse will be deleted from the site and prohibited from future registration at Investing.com’s discretion.

Write your thoughts here
 
Are you sure you want to delete this chart?
 
Post
Post also to:
 
Replace the attached chart with a new chart ?
1000
Your ability to comment is currently suspended due to negative user reports. Your status will be reviewed by our moderators.
Please wait a minute before you try to comment again.
Thanks for your comment. Please note that all comments are pending until approved by our moderators. It may therefore take some time before it appears on our website.
Comments (2)
Javier Escamilla
Javier Escamilla Apr 19, 2021 4:49PM ET
Saved. See Saved Items.
This comment has already been saved in your Saved Items
Thanks again! I have a conservative position on E/U (sells with sl in the money already), closed my Cisco calls, because i did not like they way nasdaq closed today, opened a few calls on GOLD, although is still overbought and just a couple of puts for KO as a swing trade.
Pinchas Cohen
Pinchas Cohen Apr 19, 2021 4:49PM ET
Saved. See Saved Items.
This comment has already been saved in your Saved Items
You're welcome Javier.euro long is good. I don't blame you about the Nasdaq, though Cisco overall looks good having completed a continuatoin pattern. I hope you have a widestop loss on gold, because I expect it to dip first toward 1,740 before and if it continues higher against its falling channel. How do you figure it's overbought? Don't like putting KO after having completed a continuatoin pattern.
Eric Best
Eric Best Apr 19, 2021 10:09AM ET
Saved. See Saved Items.
This comment has already been saved in your Saved Items
Great Article
Pinchas Cohen
Pinchas Cohen Apr 19, 2021 10:09AM ET
Saved. See Saved Items.
This comment has already been saved in your Saved Items
Thanks, Eric
 
Are you sure you want to delete this chart?
 
Post
 
Replace the attached chart with a new chart ?
1000
Your ability to comment is currently suspended due to negative user reports. Your status will be reviewed by our moderators.
Please wait a minute before you try to comment again.
Add Chart to Comment
Confirm Block

Are you sure you want to block %USER_NAME%?

By doing so, you and %USER_NAME% will not be able to see any of each other's Investing.com's posts.

%USER_NAME% was successfully added to your Block List

Since you’ve just unblocked this person, you must wait 48 hours before renewing the block.

Report this comment

I feel that this comment is:

Comment flagged

Thank You!

Your report has been sent to our moderators for review
Continue with Apple
Continue with Google
or
Sign up with Email