By Pinchas Cohen
The book, 'If it Ain't Broke...Break it' by Robert Kriegel and Louis Palter, discusses how a company must constantly be striving to stay ahead of the curve, in order to achieve and maintain its success. While it was published in 1992, its ideas are even more relevant today as the post-internet business environment is lead by companies such as Facebook Inc (NASDAQ:FB), Google (NASDAQ:GOOGL), Amazon.com Inc (NASDAQ:AMZN) and Alibaba Group Holdings Ltd (NYSE:BABA).
One company that could definitely benefit from learning to operate in today's fast changing business environment is Walt Disney Company (NYSE:DIS), which reports earnings on Tuesday. Analysts predict a $1.55-$1.57 range EPS, 4 percent decline YoY, 3 percent gain QoQ, on an expected $14.47 billion revenue, with a 1.3 percent increase YoY and 8 percent increase QoQ.
From a technical perspective, there are two sets of mixed signals. On the one hand, the daily price chart points up. However, comparing averages of different periods as well as momentum points down, as does the weekly price chart. This provides an opportunity for short term longs and long term shorts.

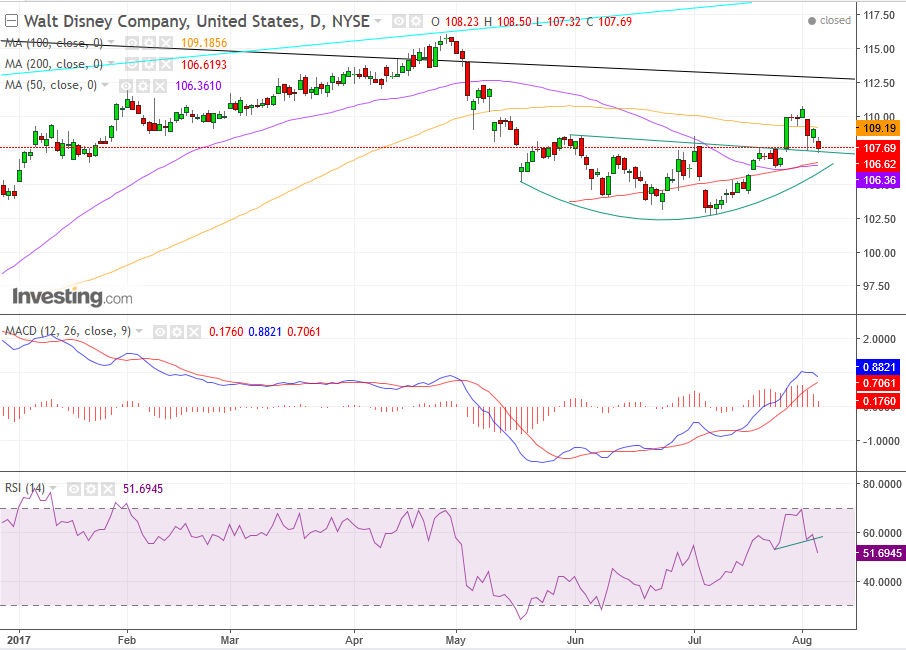
Between May 17 and July 26, the price traded within a rounding bottom pattern. On July 27, the price broke out, suggesting a reversal. The price returned within a return move. The rounding bottom’s neckline provided support. The price closed on Friday above the neckline. Note that the 50 (purple) and 200 (red) moving averages met, while the 100 (orange) is just above.
This confluence of the major moving averages suggests a potential catalyst. While the price crossed above both the 50 and 200 dma, which is bullish, it fell back below the 100, which is bearish. Also, the 50 crossed below the 200, which is bearish.
The MACD, which compares averages of different periods, is showing that the longer averages are declining relative to the shorter ones and the longer is on course to cross below the shorter – demonstrating that the recent price averages are falling relative to longer ones.
The fact that price is about to fall from an overbought condition also suggests an impending decline. While the bottom pattern’s neckline held up the price, the leading momentum RSI completed a top, when it crossed below its neckline, suggesting the price may follow suit.
The volume was higher on the breakout than on the decline, which lends credence to the breakout validity. Despite the mixed signals from indicators, the bottom’s neckline is holding.

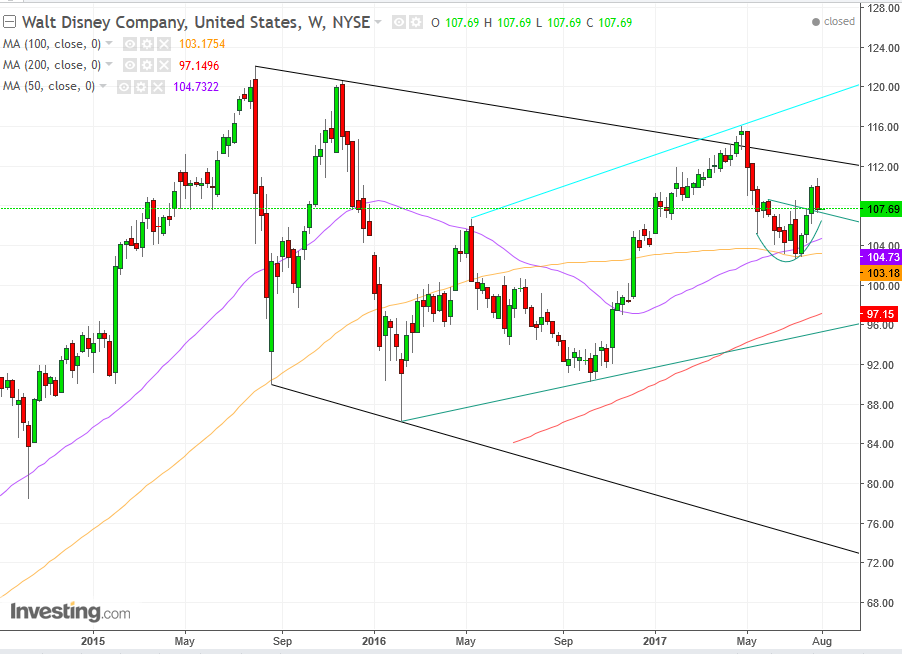
The price has been trending within a falling channel for two whole years since August 2015. Therefore, the long-term trend is down. However, notice how the 50 and 100 week moving averages cradled the price, acting as a catapult, while the 200-week moving average rushed to add support to the shorter, corrective uptrend line since February 2016.
Those are bullish indications. Long term movements end. Maybe this one is about to, as well. Note how the two previous declines within the channel were straight downwards plunges. This is the first occurrence of such a “fight back”. Still, for as long as the price remains within the channel, it should be considered a downtrend.
Summary: We are short-term bullish, per the price action on the daily chart and long-term bearish, per the weekly chart, unless of course the $116 level of the previous peak April peak is breached. Not only would that break out of the falling channel, but it would constitute a third ascending peak.
Short-term Trading Strategies – Long
Traders may enter a long position, with a stop-loss beneath the $107 neckline or beneath the $106 July 25 trough and the 200 dma.
Short-Term Targets:
- $110 – the psychological key level
- $110.83 – the August 1 high
- $112.50 – the channel top
- $115 – the psychological key level
- $116.10 – the April 27 high
Long-term Trading Strategies – Short
Conservative traders may wait on a short for a correction to $110.83 Friday high, $112 channel top or $116 April high.
Moderate traders may wait on a short for a correction to the $110 key level.
Aggressive traders may short now.
Long-Term Targets:
- $104 key level
- $104.73, 50 wma
- $103.17, 100 wma
- $100 key level
- $97 200 wma (red) and uptrend line since February
- $95 key level
- $93 October trough
- $90 key level
- $86 February 2016 trough
- $85 key level
- $80 key level
- $75 key level
- $70 key level
Just as AOL and Yahoo (NASDAQ:AABA) and many other media giants failed to change with a changing world, Disney is bleeding subscribers. Until Disney figures out how to adapt to the internet age, as did Microsoft (NASDAQ:MSFT) and Amazon, it will be a giant with heavy footsteps, left behind to live unhappily ever after.
