It has been a good few days for risk and as another week draws to a close, the major stock indices are looking quite bullish, despite ongoing concerns over the coronavirus situation in the US. Sentiment remains supported by several factors, not least improving global economic data, as lockdown measures ease across most parts of the world.
Indeed, the strong showing in US employment was the trigger behind Thursday’s rally. Today, we’ve learnt that China’s services activity expanded at its fastest pace in over a decade last month, according to the sector’s PMI. Activity within the European services industry also topped expectations, with Spanish flash PMI unexpectedly rising above the boom/bust level of 50, while the French, German and Eurozone PMIs were all revised higher.
However, with the US markets closed in observance of Independence Day, it may be a quieter-than-usual session. Still, the major European equity indices look quite strong and the latest Chinese and European services PMI data could provide fuel for the rally to continue, even without the participation of US investors.
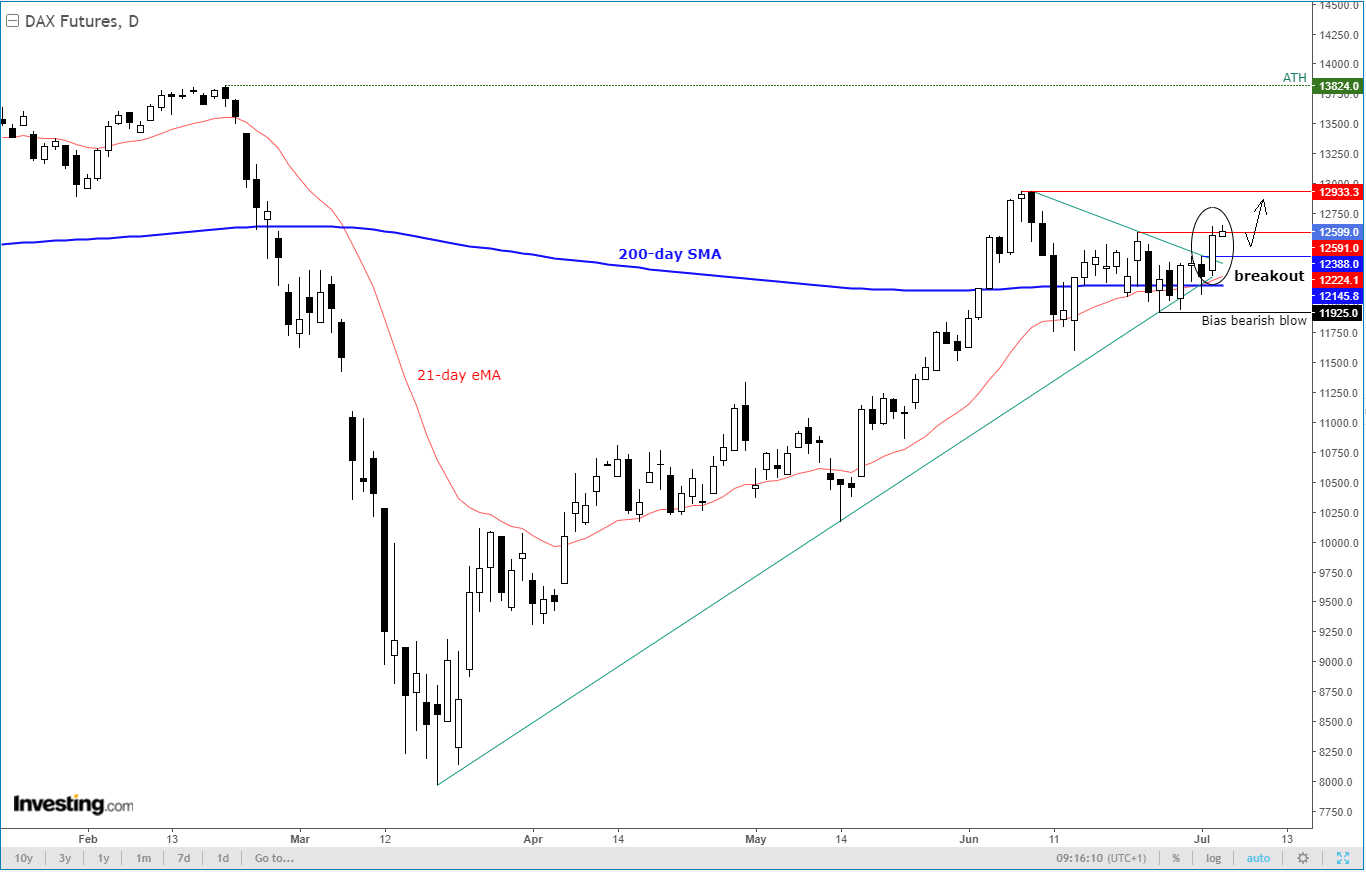
Meanwhile from a technical point of view, the German DAX looks rather constructive, compared to some of its European counterparts, as it closes in on this year's record highs.

The chart of the DAX futures shows a clear breakout on the daily time frame after the recent consolidation was resolved on Thursday, by the index moving above its resistance, rather than the support, trend line. Meanwhile, the 21-day exponential moving average has also crossed above the 200-day simple MA, which is an objective way of confirming the bullish trend.
Now, the point of origin of the breakout is at 12385/90 on the daily time frame. This level needs to hold for the bulls to sustain control of price action. While above here, any short-term retracements should not worry the bulls on Friday or early next week.
However, a move back below 12385/90 would put the bulls in a spot of bother, as this would provide an early indication that the breakout may have failed. And the buyers would be in real trouble if the recent low prior to the latest rally, breaks. That low comes in at 11925. If the index were to move below here, it would also see the longer-term bullish trend line break. So, needless to say, that would be a bearish development, if it materialized.
But for now, the path of least resistance is to the upside. As such, I expect the dips to be supported and resistances to continue giving way. Talking about resistance, one hurdle that was being tested at the time of writing was at 12590. If and when we cleanly break above this, then the recent high at 12933 will come into focus next, above which there is nothing too significant until the pre-lockdown, and all-time, high at 13824.
