Who is Kevin Hassett? Wolfe looks at the Trump ally tipped to become Fed Chair.
Could Amazon (NASDAQ:AMZN) possibly go even higher? The short answer is yes.
While some investors may have become a bit jittery over reports that the company's CEO and President, Jeff Bezos, was offloading large blocks of stock, it doesn't necessarily mean he’s planning to abandon ship, nor does it reflect his estimation of his company’s value.
The world's richest man has been shopping around for a monster mansion with his girlfriend and no doubt, has other big expenses.
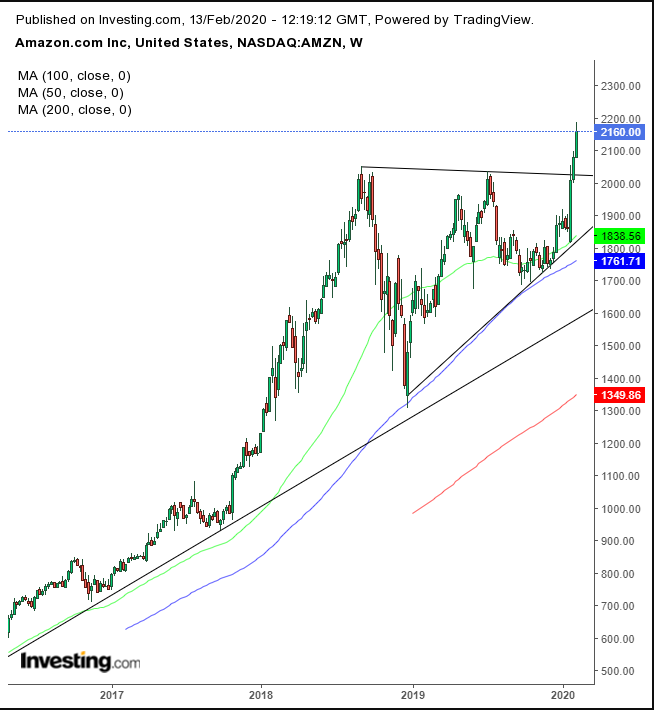
Looking at the chart, it’s clear there's still plenty of demand for the mega e-retailer's stocks.

The shares broke through the top side of an ascending channel since the early-September 2018 high. When trading is trapped within a range, it means that the collective investor considers it to be worth somewhere within that range of prices. When it breaks above or below, it indicates there's been a change in that valuation. That is true for a pattern that lasts even just a short while — and becomes even truer for a pattern that's lasted 18 months.
The recent break means that something significant must have changed in the sum total of the supply-demand balance for it to suddenly alter its course. To be fair, however, the price had an upside bias from the get-go.
To begin with, it’s been in an uptrend. Second, while it’s highs remained level, the lows have increased over time, demonstrating that demand was the driving force. Once demand absorbed all the supply available within the range, it broke out to find new willing buyers, at higher prices. Such moves create a chain reaction, leading to another rally.
The 50 DMA crossed over the 200 DMA, triggering a golden cross, as all the stars aligned for another long-term rally. And, considering the size and duration of the ascending triangle, we wouldn’t be surprised if the shares are now targeting $3,000, within the next 18 months.
The stock closed yesterday below Tuesday’s High Wave candle, increasing the likelihood of a return move, to retest the 18-month long pattern.
Trading Strategies
Conservative traders would wait for a full pullback, literally bouncing off the top of the triangle, at $2,025, before entering a long position.
Moderate traders may enter at around $2,075, above the January-February congestion.
Aggressive traders may enter a contrarian short, riding the return move, before joining the market with a long position of their own.
Trade Sample
