Chart of the Day: FedEx's Long-Term Uptrend Ends As China Strikes Back

Published 06/04/2019, 10:01 AM
Updated 09/02/2020, 02:05 AM

U.S.-Sino tensions have escalated yet further, following the U.S. ban against Chinese telecom giant Huawei. this past weekend, Beijing went after global shipper FedEx (NYSE:FDX), claiming it diverted packages from Chinese customers, without authorization, “damaging [the] rights of Chinese clients.”

Regulators in the Asian country yesterday launched an 'inquiry.' Although Huawei or any trade-related keywords were not mentioned, there's little doubt the timing isn't accidental. Clearly, China is targeting FedEx in retaliation for the Trump administration blacklisting Huawei.

The equity market concurs. The Memphis-based company’s stock has fallen 4.75% since Thursday.
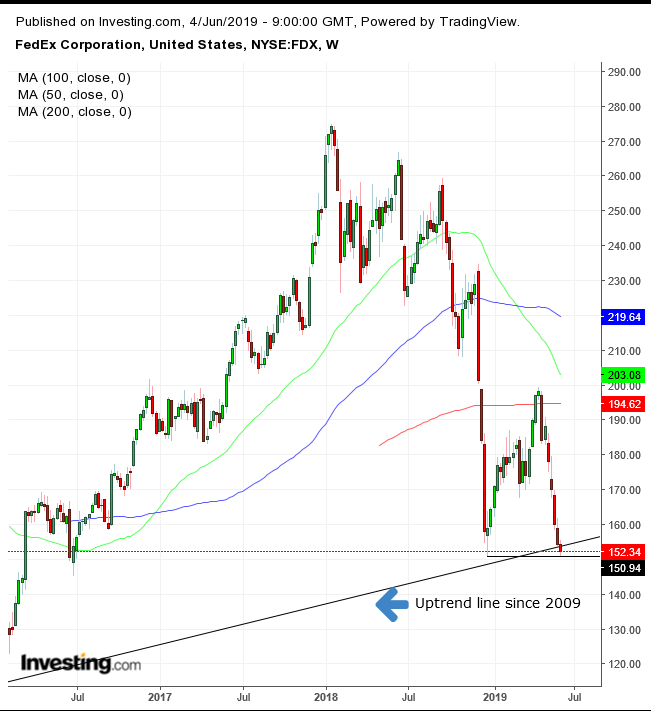
FedEx Weekly Chart

The stock crossed below its uptrend line since the 2009 bottom for the first time in ten years, suggesting an end to the long-term uptrend. However, price found support in the December lows. In other words, even if prices would continue lower, it could occur after extreme whipsawing.

In the long run, however, risk is to the downside. After crossing the long-term uptrend line for the first time, and as the 50 WMA crashed through the 100 WMA. Currently, the price is speeding toward a downward curving 200 WMA, below the previous medium-term trough in mid-April.

Trading Strategies

Conservative traders should wait for another lower peak in the medium-term, which would follow a medium-term trough below December’s.

Moderate traders are likely to wait for a decisive downside breakout below the $150.00 mark, followed by a return move that demonstrates obvious resistance.

Short Trade Sample

  • Entry: $150
  • Stop-Loss: $151, above December lows
  • Risk: $1
  • Target: $145, June 2016 lows
  • Reward: $5
  • Risk-Reward Ratio: 1:5

Aggressive traders may risk a contrarian, long position, counting on the most extreme oversold levels since the December rout and potential support at the December lows.

Long Trade Sample

  • Entry: $152
  • Stop-Loss: $151
  • Risk: $1
  • Target: $157, March, May lows
  • Risk-Reward Ratio 1:7

Latest comments

Loading next article…
Risk Disclosure: Trading in financial instruments and/or cryptocurrencies involves high risks including the risk of losing some, or all, of your investment amount, and may not be suitable for all investors. Prices of cryptocurrencies are extremely volatile and may be affected by external factors such as financial, regulatory or political events. Trading on margin increases the financial risks.
Before deciding to trade in financial instrument or cryptocurrencies you should be fully informed of the risks and costs associated with trading the financial markets, carefully consider your investment objectives, level of experience, and risk appetite, and seek professional advice where needed.
Fusion Media would like to remind you that the data contained in this website is not necessarily real-time nor accurate. The data and prices on the website are not necessarily provided by any market or exchange, but may be provided by market makers, and so prices may not be accurate and may differ from the actual price at any given market, meaning prices are indicative and not appropriate for trading purposes. Fusion Media and any provider of the data contained in this website will not accept liability for any loss or damage as a result of your trading, or your reliance on the information contained within this website.
It is prohibited to use, store, reproduce, display, modify, transmit or distribute the data contained in this website without the explicit prior written permission of Fusion Media and/or the data provider. All intellectual property rights are reserved by the providers and/or the exchange providing the data contained in this website.
Fusion Media may be compensated by the advertisers that appear on the website, based on your interaction with the advertisements or advertisers.
© 2007-2025 - Fusion Media Limited. All Rights Reserved.