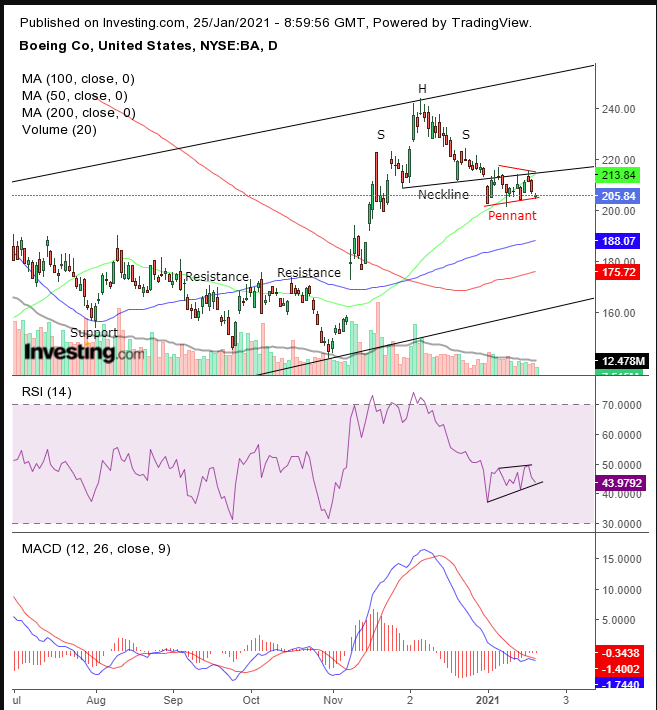
On Dec. 8, we discussed the possibility of an upside breakout from a rising channel for Boeing (NYSE:BA) shares. At that time we advocated for a long position based on the technical chart, in case of a breakout, but also provided a contrarian-short position, for aggressive traders.
Afterward, there was no breakout, but the short position worked. Now, the stock is facing additional pressure.
Despite recent positive news for the Chicago-based aviation giant, such as the company securing a $2.1 billion deal with the US Air Force, and Boeing announcing its entire fleet will fly 100% on biofuel by 2030, the fundamentals aren't fully lining up.
A Boeing 737 crash in Indonesia on Jan. 9 occurred shortly after Boeing's 737 MAX model—which had been grounded worldwide since March 2019 after two fatal crashes killed 346 passengers—was finally given clearance to fly again. Now, Indonesian investigators are looking into whether a problem with the plane's autothrottle system, contributed to the Sriwijaya Air crash.
Naturally, that can't be beneficial for the stock. Today we're providing an outright bearish call, though, of course, we can't know what the future holds. But based on the technicals, we’d have to say the stock is nowhere near take-off, unless you intend on shorting.

The stock is trading within a pennant, a period that allows for new bears to come in, after early bears enjoyed up to a 41.5% downside move in the very short term between the Dec. 7 high and the Jan. 4 low.
A downside breakout of the pennant would all but prove that the takeover is complete and that sellers are willing to compromise on prices, bolstering short positions and forcing an additional leg lower.
Since technical analysis is the discipline of studying the forces of supply and demand, it’s important to see the context of a pattern or indicator. This pennant is part of a 'return move' that followed a H&S top. Its resistance is the neckline of that reversal pattern. The H&S itself developed at the head of a rising channel and is the path back toward the bottom of the channel.
The 50 DMA points at the key juncture where the pennant top and the neckline meet. The 100 DMA reveals the next support level; this MA’s significance is revealed as it played a consistent support and resistance role since the August low.
Finally, the 200 DMA (as well as the 100 DMA) realigned with the channel’s trajectory, as it 'prepares' to stop the fall toward the channel.
The RSI shows that momentum mimics and therefore supports the price move. The MACD’s short MA found resistance and is falling away from the long MA. And recent prices are again weakening compared to earlier ones—a bearish signal.
Caution: Volume spiking when the price rises and diminishes when the stock falls indicates that shares are still in an uptrend, while the ideal short would occur amid a downtrend.
Trading Strategies
Conservative traders should wait for the price to bounce off the bottom of the rising channel, for a long position.
Moderate traders would wait for the pennant’s downside breakout, to short.
Aggressive traders could short now, provided they understood and accepted the risk, and have a well-thought-out plan they commit to.
Here’s an example:
Trade Sample
- Entry: $207
- Stop-Loss: $217
- Risk: $10
- Target: $177
- Risk: $30
- Risk:Reward Ratio: 1:3
