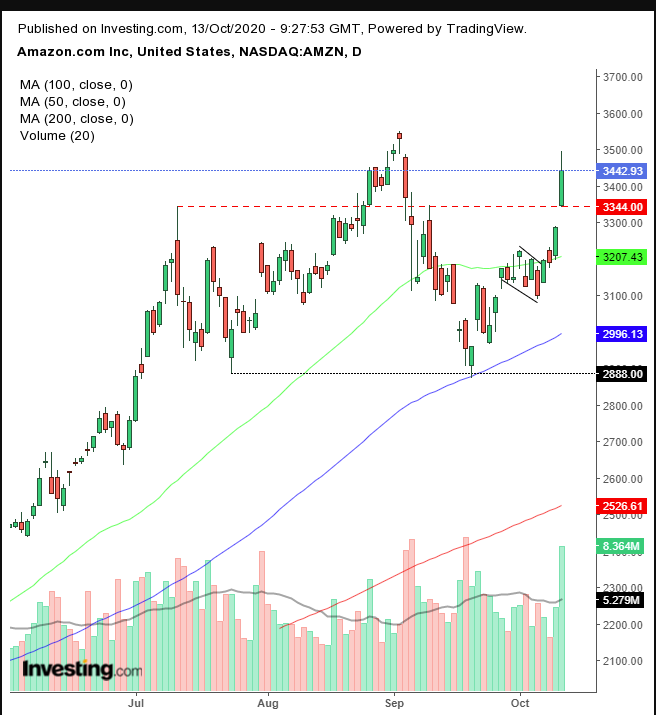
Looks like investors are once again bullish on Amazon.com (NASDAQ:AMZN). Shares of the mammoth online retailer closed up 4.75% on Monday, finishing the day at $3,442.93.
The current exuberance is likely tied to the arrival of the company's annual Prime Day event, a two-day sale that begins today, Tuesday, Oct.13 and runs through tomorrow. It's considered the company's biggest selling event, during which this year Americans are expected to kickstart their holiday purchasing.
Though previous Prime Days occurred in July, this year's event was delayed because of the coronavirus outbreak. Nevertheless, it's anticipated that "people will spend up to $10 billion on Amazon this week." Indeed, some analysts expect this may be the most profitable Prime Day ever.
No wonder investors are primed to drive the stock higher, notwithstanding that shares recently plummeted when news broke that US lawmakers were looking to break up some of the country's biggest tech companies, including Amazon, because of monopolistic practices.
What a difference a week can make. Clearly, trader sentiment—and the technical outlook—on the Seattle-based e-tail giant has shifted.

After the supply-demand balance processed the anti-competitive legislative news, the price began developing a falling flag. That happens during profit-taking after a sharp move, in this case nearly 12% from the low of Sept. 21 to the high of Oct. 1, while new demand absorbs the sudden spike in supply.
On the chart, this is projected by the downward-biased but congested range, showing how crowded with traders these prices have been. This then continues to drive the price higher after all available supply has been consumed and buyers seek additional supply, even at higher prices.
Note, after the flag’s upside breakout, the stock formed a rising gap, which cleared away the July 13 high, the left shoulder of a H&S top, with surgical precision, when the price opened right on top of it and continued higher—backed up by the highest green volume since April.
That suggests the H&S top in-the-making is over, forcing shorts to cover themselves, which both reduces supply and increases demand, which may also have formed the gap.
The flag’s implied target suggests a new record high is ahead. Plus, these patterns have statistics on their side. For example, H&S patterns follow though about two-thirds of the time. That means that one-third of the time they fail. And it appears this one is one of those times.
But, to clarify, we don’t know what the future holds. We're simply weighing the evidence. For all we know, the price rose ahead of the big event and will fall as the sales proceed.
Note, the price—which pared session highs yesterday—closed below its peak. It could jump above it if expectations are met or exceeded, but it could also fall back, if they disappoint, which would make a play for a double top. Plus, there's always the anti-trust issue lurking in the shadows.
For now though we'll go with higher prices ahead.
Trading Strategies
Conservative traders should wait for new highs, followed by accumulation, before committing to a long position.
Moderate traders may wait for a pull-back, after the short squeeze effect fades, to retest the pattern’s support.
Aggressive traders might enter a contrarian short position to ride such a likely return move, knowing the risks involved and trading accordingly. Here’s an example:
Trade Sample
- Entry: $3,500 – psychological round number above yesterday’s trimmed highs
- Stop-Loss: $3,550 – psychological round figure above the Sept. 2 peak
- Risk: $50
- Target: $3,300 – round number within the gap
- Reward: $200
- Risk:Reward Ratio: 1:4
