When the Democratic Blue Wave failed to materialize after last week's US election, big-tech investors were relieved. If Democrats don't have control of the Senate they reasoned, it's unlikely tighter regulations that would break up some of the FAANG monopolies—thereby limiting their rich profits—will ever be enacted.
As such, trumpeted some headlines, "There’s Never Been a Better Time to Buy Amazon Stock.” Adding weight to that argument: According to the US Department of Commerce, only 16% of US retail sales in the second quarter were online. And this was during the pandemic. That would provide plenty of runway for Amazon (NASDAQ:AMZN), the world's largest online retailer, to increase its dominance, and accelerate its share price, currently at $3137.39 as of Wednesday's close.
Mad Money host Jim Cramer, on the other hand, is less enamored with Amazon right now. He cites the European Union's current charges against the e-tail giant, of using "its size, power and data to gain an unfair advantage," as a reason to sell the stock.
Even if you believe that now is a good time to buy Amazon, after this year's 70% surge, there's an argument that the shares are overvalued, making them far less appealing—at least in the short-term—than cyclical shares that were pummeled by the pandemic.
To be fair, the price of the stock has been moving sideways since early July, allowing for anyone to cash out should they wish, before, clearing the way for another move higher. Since prices don't go up in a straight line, once buyers take profit, reducing demand speculators generally short, increasing supply."
Beware, however, if shares fall to $2,800, that's likely to set in motion a stronger drop, pushing the price even lower.

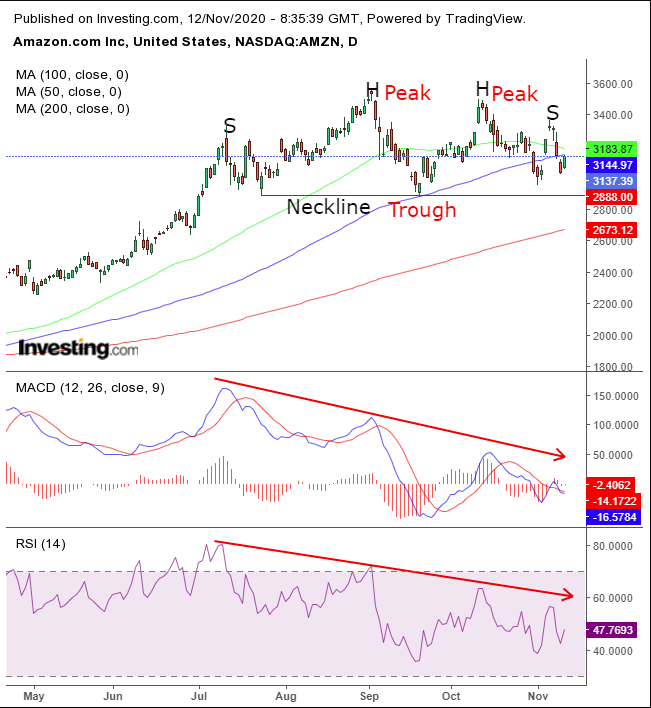
AMZN has been trading within a complex H&S top since the July 13 high. This pattern shows repeated, bullish attempts to make new highs. But its failure demonstrates weakness.
However, the pattern isn't complete until there's evidence that demand dried out and sellers are willing to compromise on asking prices, which would provide for a downside breakout. This could trigger shorts and stop-out longs, furnishing energy for another leg lower.
While the price violated the 50 DMA in both directions, it fell below the 100 DMA on Oct. 2, for the first time since the March bottom. After trying to push above it on Nov. 4, the price topped out with two dojis, demonstrating a lack of conviction once again. This triggered another two-day selloff that pushed prices back below the 100 DMA.
Yesterday’s rebound ended precisely below the 100 DMA, demonstrating resistance, at least for now. While that doesn’t mean bulls are gearing up for another advance over the 100 DMA, now that the 50 DMA resides above it for the first time since March, it will take a stronger show of force to cut through what is becoming an escalating pressure point for bulls.
The MACD and RSI provided negative divergences, each falling versus the rising price between the July 13 high, or the left shoulder and the Sept. 2 all-time high, or the left head, demonstrating that two key momentum indicators are no longer providing support to the rally.
The fact that the RSI and MACD both fell while the price accelerated is a bearish signal, suggesting there's no power behind the move, setting it up for a decline.
If the price falls below the low of Sept. 21, it's likely the last stronghold of demand will have been absorbed, barring any drastic, unknown changes. This would send sellers into a panic, causing them to dump shares at practically any price.
Note that the 200 DMA ascends toward the neckline to provide support, accentuating the significance of this price level in the supply-demand balance.
Trading Strategies
Conservative traders would wait for the price to complete the pattern, with a downside breakout, with at least a 3% penetration to $2,783 over a 3-days period—preferably, to include a weekend—to avoid a whipsaw. Then, they’d wait for a return-move that would demonstrate that the trend has indeed reversed, with overwhelming selling at the levels of the pattern.
Moderate traders are likely to be content with just a 2% penetration and at least a two-day filter to avoid a bear trap.
Aggressive traders would short at will, provided they have a plan that includes a favorable risk-reward ratio, relative to their chosen support and resistance. Here’s an example:
Trade Sample
- Entry: $3,143
- Stop-Loss: $3,183
- Risk: $40
- Target: $2,743
- Reward: $400
- Risk:Reward Ratio: 1:10
Author's Note: This is just a trade sample. That means there are different ways in which to approach this trade, based on your timing, budget and style. You can change your entry by waiting for a downside breakout or for a rally that would retest the Nov. 5, $3,365.52, right shoulder high. You can change your stop-loss and target for a quicker, less ambitious, trade. You can even change all parameters.
All could be right or wrong. What’s important is to have a plan. Then, you can experiment and learn what’s best for you. Trade small till you get the hang of it and realize that, like any other profession, if you want to make money you need to have the education and experience. There are no short cuts. Good trading!
