Amazon (NASDAQ:AMZN), the Seattle-based online retail behemoth had been doing well even before the COVID-19 pandemic brought the world to a halt last year. But once lockdown measures were initiated, with large swathes of the global population forced to shelter in place, leaving consumers with fewer shopping options, the company's revenues skyrocketed.
So much so that yesterday, when Amazon reported Q4 2020 results, not surprisingly, the company beat expectations.
The real surprise during yesterday's conference call were remarks by founder and CEO Jeff Bezos who said he will "step down as CEO and become executive chairman," effective this summer, to focus all his time and energy on new products and early-stage initiatives. Bezos is handing the CEO reins to Andy Jassy, currently head of the company's highly successful Amazon Web Services (AWS) division. However, Bezos went to say: “we are firing on all cylinders, just as the world needs us to. We have things in the pipeline that will continue to astonish.”
The mega cap tech company’s fourth quarter results were indeed eye-popping. Revenue catapulted 44% YoY to a record $125.6 billion, up from $87.4 billion, and up from $96.1 billion in the previous quarter. Net income was $7.2 billion, delivering EPS of $14.09, up from $3.3 billion, or $6.47 EPS...more than double. The company's results clearly decimated expectations.
With fundamentals so robust, and Bezos' words regarding more product upside to come, the supply and demand balance on the technical chart looks highly promising as well.

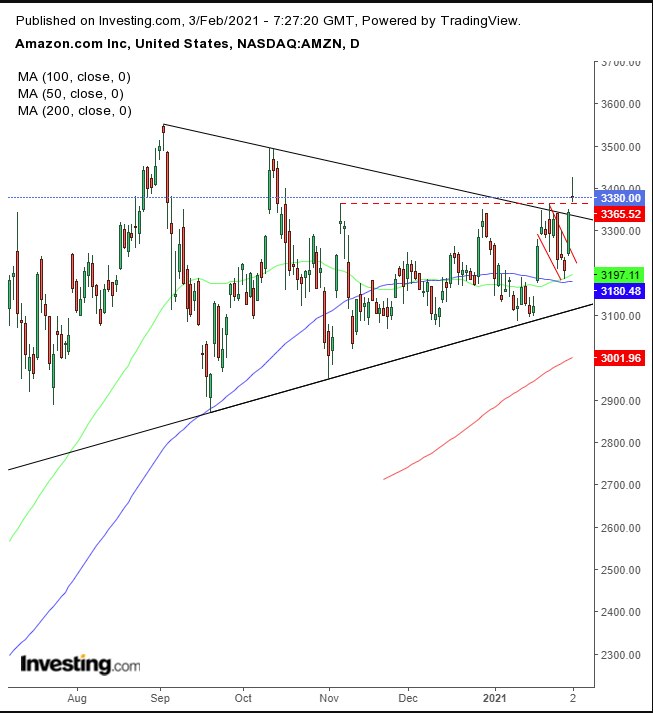
Amazon extended the upside breakout of a falling flag, by completing a symmetrical triangle in the direction of the uptrend. The flag tilts in the opposite direction of the trend, like a slingshot.
This continuation pattern is made by the changing of forces, between bulls who enjoyed the preceding 8% surge in just three sessions, from Jan. 19-21, and traders who missed out but are determined to repeat that move on the other side of the flag. Profit-taking pushed the flag lower, as the newcomers took a few steps back to gather speed, so that prices could continue springing higher.
That momentum allowed the price to also break through the horizontal resistance at $3,365, in place since Nov. 5, then through the top of the symmetrical triangle.
Caution: Yesterday’s trading developed a doji within a rising gap on heavy volume, following a long green candle. This could prove to be the makings of an evening star, a bearish pattern. We discussed this rare bearish pattern in December with regard to Amazon, but its potential for downside momentum seems to have fizzled.
Unless some unforseen black swan event related to the company occurs or unlikely, relevant negative news is revealed, we expect the overwhelmingly positive fundamentals and technicals to more than outweigh this bearish potential.
Trading Strategies
Conservative traders should wait for the price to clear the doji high, followed by a return-move that verifies the support above the symmetrical triangle.
Moderate traders would wait for any buying dip.
Aggressive trades could go long, provided they understand and accept the risk of a lack of confirmation and filters, and can hold on for any fluctuations. For this, a coherent trading plan is even more important than normal.
Here’s just an example.
Trade Sample
- Entry: $3,380
- Stop-Loss: $3,280
- Risk: $100
- Target: $3,980
- Reward: $600
- Risk:Reward Ratio: 1:6
