After Google parent Alphabet (NASDAQ:GOOG) publishes Q4 results on Tuesday, Feb. 2 after the close, we expect the stock will jump significantly.
Consensus calls for the company to report $15.7 EPS, slightly higher than the $15.35 for the corresponding quarter last year. Even more impressive, the revenue expectation is likely to come in at $52.89 billion, up from the $46.98 billion posted last year during the same quarter. That Google has managed to expand amid the worst health crisis in a century tells the entire story.
Fundamentally, the world’s largest search engine is forecast to enjoy massive growth in advertising in 2021. That's prompted Wall Street analysts to place a strong buy recommendation on the stock.
JPMorgan analyst Doug Anmuth projects a 19% increase in revenue growth for Google search, and a 38% boost for YouTube's ad business. Anmuth also foresees the tech giant’s cloud activity finally nearing profitability, after years of heavy spending on the project. He also expects further commercialization of Waymo, Alphabet’s autonomous-driving subsidiary.
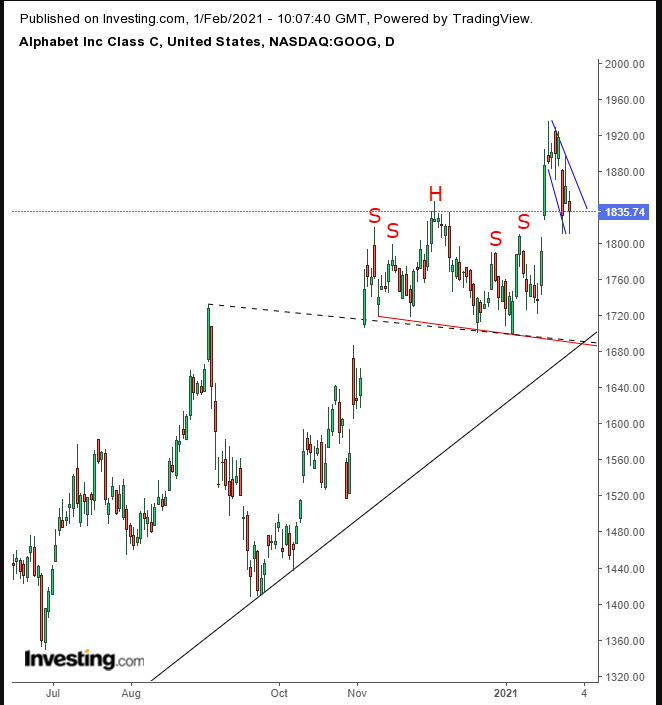
Technically, the price has reversed what would have been a bearish pattern, turning it bullish.

The price was trading along a H&S top pattern, demonstrating a weakening uptrend, that then reversed into a downtrend. On Jan. 20, however, the price surged 5.4%—blowing out the pattern. The move left analysts perplexed, unable to find a specific reason for the robust jump.
Though there was mixed news on the company that day, there likely wasn't a direct catalyst. Some pointed to Netflix's (NASDAQ:NFLX) blowout Q4 results the previous day as the driver for a broader tech rally as investors regained their optimism on the sector.
Then, last Wednesday, renewed reports of potential government scrutiny and regulation in Europe pressured the stock, which plunged 4.5%. Shares fell along with other mega tech firms.
The price then found support precisely at the top of the failed H&S pattern. The nature of supply and demand is perfectly illustrated here, the way it builds and reverses. The same thing happened between the Sept. 2 high, a resistance, that seamlessly aligned with the (red) neckline of the H&S, and the way it turned into a support.
As such, we consider the recent tech selloff to be part of a return move to retest the H&S’s integrity. Once it proves it can withstand the selling, the price should rebound and move even higher.
Moreover, the return move itself is within a falling flag, bullish after the preceding 12.4% surge within only four trading days. If demand does exceed supply as we expect, triggering an upside breakout, the flag would set its own upward momentum, serving to compound the upward pressure by the H&S which transformed from a top into a continuation pattern.
Trading Strategies – Long Position Setup
Conservative traders should wait for a new high to extend the uptrend.
Moderate traders would wait for the falling flag’s upside breakout.
Aggressive traders could go long now, provided they understand, accept and prepare for the risk.
Here’s an example:
Trade Sample
- Entry: $1,835
- Stop-Loss: $1,800
- Risk: $35
- Target: $2,000
- Reward: $165
- Risk:Reward Ratio: 1:5
Author's Note: This is just a trade sample, not the actual analysis. For the analysis, read the post. Bear in mind that the analysis is not prophecy. We don’t know the future. It only seeks to explain market dynamics and identify the most likely price trajectory. Analysis can also be wrong. Finally, your timing, budget and temperament may impact the trade. You must customize a trading plan to meet your personal circumstances. If you don’t yet know how to do that, take small risks while you learn.
