The Walt Disney Company (NYSE:DIS) is scheduled to release its corporate results for its Q1 2019, ending December 2018, after the market closes today. The forecast calls for $1.54 earnings per share on $15.07 billion in revenue. Those estimates are lower than the results from the corresponding quarter a year earlier, which beat estimates. It's possible today’s numbers can do the same.
In fact, Disney has beaten more than two thirds of EPS calls and over half of revenue expectations in the last 16 quarters. We’re willing to bet the entertainment giant will beat the forecasts today as well, based on signals we're seeing in the stock's technical chart.

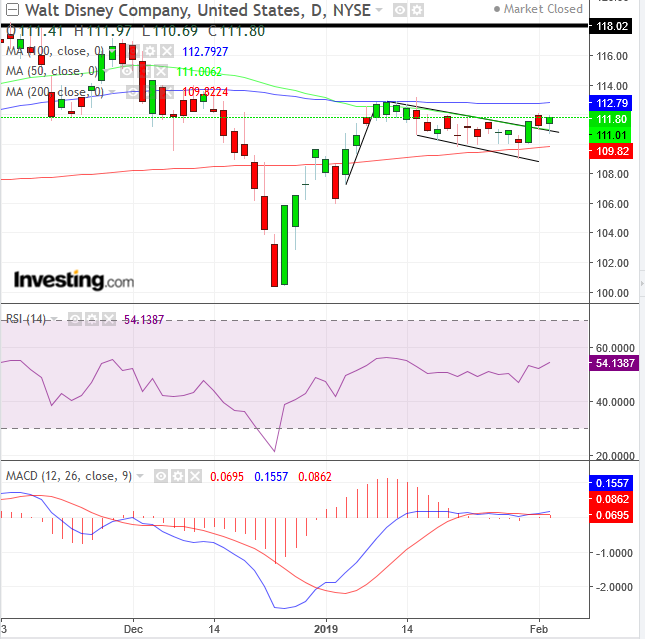
The stock price had been churning since January 8, tilting lower, till this past Thursday. This consolidation followed a sharp move since the post-Christmas rally. These are all the signs of a falling flag, a bullish continuation pattern amid a rally.
First, there is optimism, charging a sharp, upward move. Then, traders—feeling that the security may have gotten ahead of itself—cash out to take a breather and to see which way the wind blows. This pause in the trend affords new blood the opportunity to come into the rally, without chasing the stock.
While it may seem counterintuitive for a bullish pattern to “fall,” it is the visual representation of all the supply at these levels prepared to unload into the waiting arms of fresh bulls, ready to charge on. Note, the angle of the falling flag is nowhere near the steepness of the initial move, called the “flag pole.” That’s because all the supply has in fact found demand.
Once all the supply is absorbed, eager young bulls seek more shares at higher prices, breaking out of the flag. That sends the signal to the bulls of the first round that the underlying uptrend is likely to resume and they jump right back in too, pushing the price higher.
Bears, who have been shorting—betting on the end of an exaggerated move—rush to cover. This means they're buying back the stock to return it to the broker, adding to the demand equation and pushing prices even higher. That’s how most players all push in the same direction, upward.
A point to watch is that a flag breakout is often followed by a return move, perhaps after short traders finished covering themselves, when the price finds support above the pattern that signals that the uptrend remains intact.
Note also that the price within the flag bounced above the 200 DMA. The RSI provided a positive divergence when rising above its November high, suggesting the price will follow suit. The MACD is hovering at the zero line, after being oversold in December, gearing up to climb higher.
Trading Strategies
Conservative traders should wait for the short-term trend to meet up with a rising medium-term trend.
Moderate traders may enter a long position, after prices climb above the 100 DMA and complete a return move, which would prove the flag’s integrity, with at least one, long green candle engulfing a red or small candle of either color.
Aggressive traders may enter a long now, anticipating another earnings beat and assuming that informed money may have caused the upside breakout of the bull flag.
