Reserve currencies generally attain that status by virtue of their stability and reputation. After WWII, with the US relatively unscathed because of its distance from Europe and late entry into the conflagration, it had the only stable global economy. In addition, its status as a leading world power was acknowledged. As well, its currency was the only one backed by gold.
As a result, countries started pegging their own currencies to the dollar, leading to its uptake as the primary global reserve currency and its widespread use as an instrument for a variety of financial transactions. Today, even commodities are generally priced in dollars.
Of course, this gives the US tremendous leverage (even though the currency no longer has gold backing). The dollar's global standing is also provoking a variety of countries, some at odds with the US for geopolitical reasons, to look for ways in which to decrease their USD dependence while at the same time elevating themselves to similar status. Russia and China in particular have been working aggressively in this regard.
Right now the dollar's dynamic tends to shift between risk and safe haven status. Should the movement to decouple the dollar from its reserve position and its berth as a base for commodities succeed, it would diminish its haven status as well.
But that's a longer-term concern. In the shorter term, it looks like the dollar is heading lower.

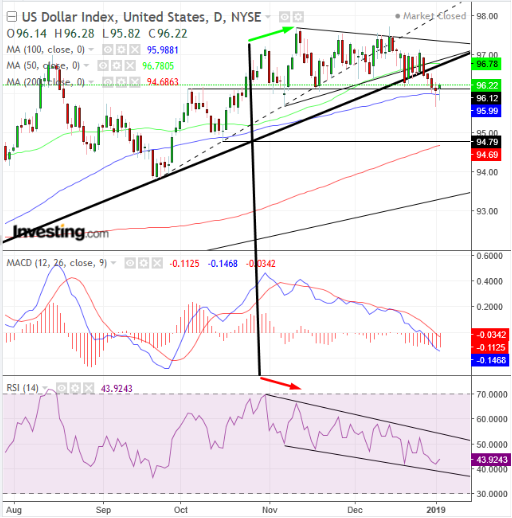
The USD completed a symmetrical triangle—a pattern when equilibrium seems to take over an asset—whose downside breakout demonstrated that supply has been outpacing demand, after it absorbed all the available demand within the pattern during a tug of war. The price crossed below the long-term uptrend line, in place since April, at the same time.
The RSI provided a negative divergence when it fell during October and November, when prices were rising on weakening momentum. Both the MACD and the RSI point at a lower trajectory, even as the price struggles on the neckline of a top, at the 96.00 level.
The 50 DMA signals the significance of the triangle bottom. The 100 DMA demonstrates the technical pressure point of the top of the neckline, while the 200 DMA points at the next main support, the 95.00 level, October's support.
While a long-term reversal has not officially taken place, a confluence of technical triggers, including the triangle pattern, the 50 DMA and the long-term uptrend line since April, is an adverse omen for the US currency.
Trading Strategies
Conservative traders are likely to wait for a long-term reversal, which would require a decline below September's 93.81 low.
Moderate traders would wait for a fall below the 96.00 level, completing a top.
Trade Sample
- Entry: 95.95 (below the psychological, round number), after first falling below 95.00 on a closing basis
- Stop-loss: 96.45
- Risk: 50 pips
- Target: 94.95
- Reward: 150 pips
- Risk-Reward Ratio: 1:3
Aggressive traders, who may not wish to wait for a complete top, might short the greenback upon a return-move to the triangle, toward 97.00, to limit exposure and attain a worthwhile risk-reward ratio.
Trade Sample
- Entry: 96.75
- Stop-loss: 97.25 (above the psychological, round number)
- Risk: 50 pips
- Target: 95.25 (above the psychological, round number)
- Reward: 150 pips
- Risk-Reward Ratio: 1:3
