We’ve repeatedly noted the negative correlation between small cap stocks listed on the Russell 2000 Index and the mega caps on the Dow Jones Industrial Average when it comes to the US's trade wars, particularly the still brewing Sino-US altercation.
As the outlook for higher tariffs increased, the Dow dropped. Its multinational companies rely on foreign markets for growth. Small caps, which are mostly domestically focused have, conversely, plenty of room for growth on their home turf. Thus, when the Dow was falling, investors were shifting cash to local companies, boosting the Russell 2000.
When the two superpowers appeared to make headway in talks, the reverse occurred. The new outlook buoyed the Dow and weighed on the Russell 2000.
Those events are the known, fundamental drivers of price movements. Our next statement, that the Russell 2000 is in the best position for a rebound, is based on the technicals, with the presumed reasons still unknown. Perhaps the trade war will worsen, providing a story for the price move. Or perhaps, the impetus will be purely technical.

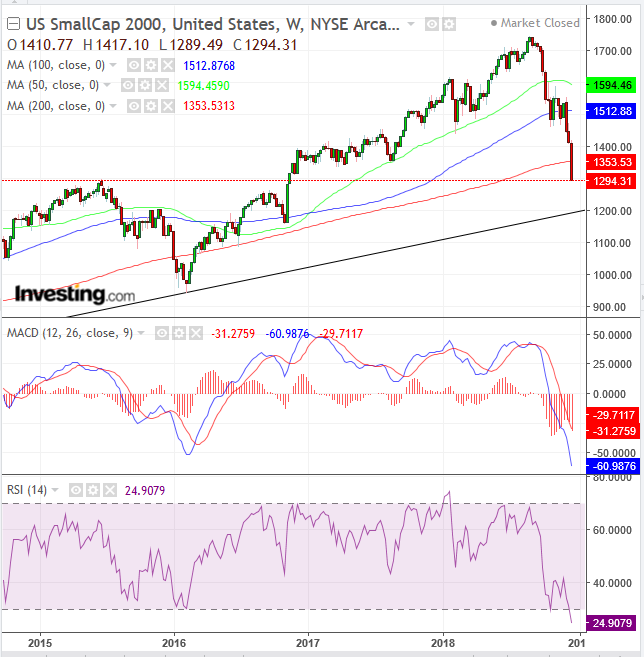
Since September, the Russell 2000 has fallen 25.6%, more than any other major US index. It's also the only major average to have already fallen below its 200 WMA.
These factors increase the bearish outlook for the benchmark. However, we believe the index has a good chance of rebounding, at least in the next weeks to a month or two.
Last week's 8-percent plunge—the worst among the major averages—stopped less than 0.1 percent above the June 22, 2015 high, the peak that led the 2016 bottom. That was the first correction for the Russell 2000 in five years and it was a brutal 26% drop.
Guess what happened the next time prices returned to the 13,000 level during November 2017? If you said there were many bears in wait, rubbing their hands gleefully for a repeat correction and the presumed windfall, you’d be right.
However, the price went up instead, creating a massive short squeeze, which only served to propel the price even higher when desperate traders rushed to cover their bets. Presumably, those traders learned their lesson, now associating that price point with a rally.
On the other hand, those mavericks who were right the first time not only made a small fortune, their egos were stroked as well. Clearly, they know a thing or two about financial markets, don’t they? Would you wager they'd be repeating the same move?
That interplay, which last occurred three-and-a-half years ago, is the presumed dynamic now supporting the current price dynamic. Both the MACD and RSI, which are the most oversold since the 2008 crash, bolster our argument.
Trading Strategies
Conservative traders trade only within the trend. As such, they would wait for an attempted rally that would demonstrate that there is still more supply than demand, with at least one long, red candle following a green or small candle of either color. We expect a return move to potentially return to as high as 1400.00
Moderate traders might risk a long position against the trend, but only after confirmation, such as a long green candle, engulfing a red or small candle of either color. Then, they would wait for the price to retest the low for a closer entry.
Aggressive traders may enter a contrarian long position, counting on the coincidence of the price ending right at the highest price of the peak before the last correction.
