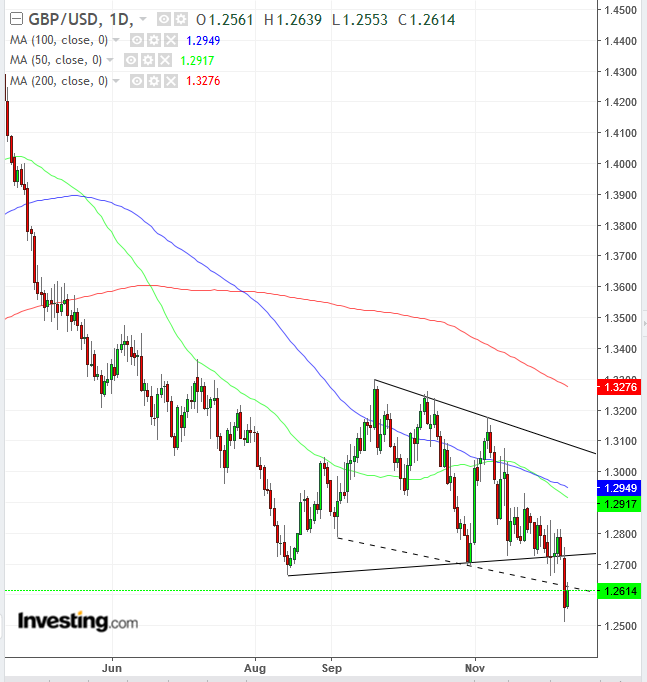
Yesterday, UK Prime Minister Theresa May delayed a critical parliamentary vote on her version of Brexit, creating even greater uncertainty for both the survival of her government and the chances of an orderly 'divorce' between the UK and European Union. Worried traders—who clearly remember the drop in sterling that began on June 24, following the June 23, 2016 referendum vote and ultimately resulted in a 23% plunge for the currency—sold off the pound. Sterling then fell to its lowest level since April 2017, a 20-month low.
Though today’s bounce trimmed half of yesterday’s losses, it may be nothing more than a corrective return move to a symmetrical triangle. This is bearish in a downtrend.

The psychology of a symmetrical triangle may be determined from its name. Both supply and demand increase, establishing a homeostasis trading path for the currency.
However, the overall presumption is that the preceding trend—in this case one that's falling—will prevail, all things being equal. The near-12 percent plunge in the currency from April-August gives the bears the advantage and they didn’t disappoint. Indeed, yesterday saw a downside breakout for sterling, pointing to the direction of the next move.
There's another, more covert pattern one can discern as well. It's a descending channel, marked by the dotted line, providing another measure for support and resistance, which may impact price moves within the symmetrical triangle. For example: today’s rebound stopped at the bottom of the descending channel.
The technical mechanics include demand absorbing supply, stopping out the bulls and removing them from the supply-demand balance at these levels. The psychology is that of a herd mentality, where traders line up in agreement that prices should head lower.
Note: the pattern penetration was 1.7 percent, which would satisfy only an aggressive 1-percent filter. Therefore, beware of a potential bear trap.
Trading Strategies – Short Position
Conservative traders should wait for a minimum 3-percent penetration, in which the price remains below the pattern for a minimum of 3 days, preferably including a weekend, demonstrating bearish commitment. Then, they’d wait for a likely return move to retest the pattern integrity, with at least one long, red candle engulfing a green or small candle of any color.
Trade Sample:
- Entry: 1.2730, after falling to 1.2340, satisfying a 3-percent filter, providing evidence of the pattern’s resistance.
- Stop-loss: 1.2800, apex resistance
- Risk: 70 pips
- Target: 1.2200, implied by pattern height, and above the support at the 2017 low.
- Reward: 600 pips
- Risk-Reward Ratio: 1:9
Moderate traders would wait for a minimum 2-percent penetration and a duration of two days in which bears hold on to the price below the symmetrical triangle, to limit the probability of a bear trap. Then, they’d wait for a return move for a better entry but not necessarily for trend confirmation.
Trade Sample:
- Entry: 1.2730, after falling to 1.2470, fulfilling a 2-percent filter, to avoid a whipsaw.
- Stop-loss: 1.2800, apex resistance
- Risk: 70 pips
- Target: 1.2200, implied by pattern height, and above 2017 lows’ support.
- Reward: 600 pips
- Risk-Reward Ratio: 1:9
Aggressive traders could risk a short now, after the 1.7 percent penetration of the bottom of the pattern.
Trade Sample:
- Entry: 1.2615
- Stop-loss: 1.2640, above today’s high, which found resistance by the hidden descending channel’s bottom.
- Risk: 25 pips
- Target: 1.2515, yesterday’s low
- Reward: 100 pips
- Risk-Reward Ratio: 1:4
