Facebook (NASDAQ:FB) is scheduled to release Q3 results today after market, with an EPS forecast of $1.46 and expectations of a $13.77 billion revenue. For the 18 months prior to its Q2 report, Wall Street ignored a series of scandals and public relations nightmares that swirled around Facebook, as a result of multiple cases of user privacy abuse.
This eventually caught up with the social media behemoth in late July, when, post its Q2 earnings release, the stock plunged almost 20 percent in a single day after the company missed revenue expectations—for the first time in 13 quarters—coming in at $13.23 billion rather than the $13.34 billion anticipated. Additionally, during the same report, Facebook said it had added only 22 million daily users worldwide. Perhaps worst of all, the advertising giant said that it had hit a plateau in the US and Canada, having saturated those markets.
Facebook shares are almost 35 percent lower since its previous earnings report. Will today's earnings release deliver enough positive news to stop the bleeding? Or will the trend be exacerbated?
Will last quarter’s earnings miss be a blip on an otherwise money-making machine, or are roaring times a thing of the past for Facebook?

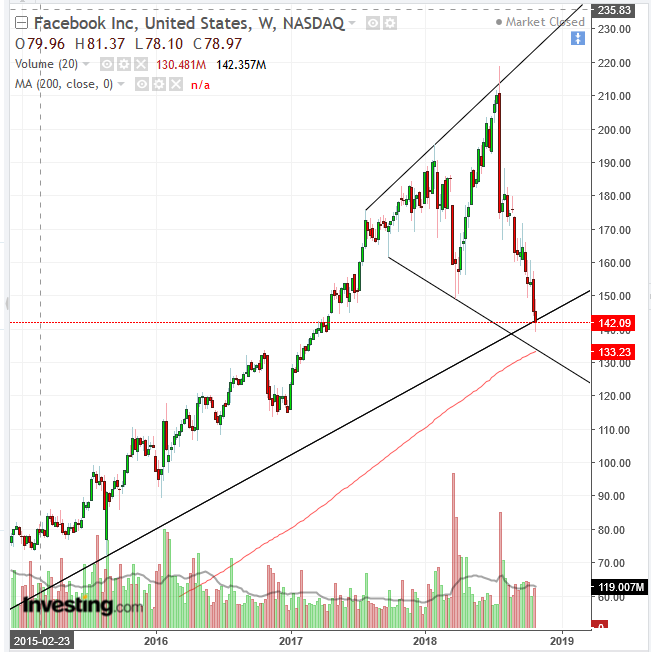
Facebook has not only been making higher highs since mid-last year, but lower lows as well, forming a broadening pattern. This demonstrates an evident lack of leadership. This type of pattern appears in market tops.
Note that the volume spikes are on declines, revealing where the impetus is, while volume dries up on rallies, demonstrating a lack of participation. Also, the price is struggling against the primary uptrend line since 2003, whose support is affirmed by the 200-week MA tracing it below. A downside breakout would also trigger these technical milestones.
It's important to note that this is perhaps the trickiest pattern for short-term trading. Since its top and bottom are always getting away, it is difficult to know exactly when the breakout will occur.
Therefore, the long-term uptrend line and 200-week MA would add weight to the evidence. Ideally, traders would wait for a downside breakout, confirmed with a return move that successfully tests the pattern bottom. However, considering the steepness of the pattern bottom, that could be difficult to attain, unless post-earnings, there's a sharp plunge.
Trading Strategies
Conservative traders would wait for a clear downside breakout, which would include the 200-week MA, on high volume. They should also wait for two descending peaks and troughs (thus far, there are rising peaks and descending troughs). Then, they'd wait for the return move to retest the integrity of the pattern successfully, with at least one long, red candle engulfing a preceding green or small candle of any color.
Moderate traders should wait for the downside breakout, including the 200-week MA, with a return move that proves the pattern’s resistance, as described above, for conservative traders.
Aggressive traders may short now, providing they accept the risk of an earnings upside surprise, which would cause spillage, when the price jumps over their stop-loss. If they are trading a CFD on the stock, and the broker guarantees against spillage, it’s fine.
