Twitter Inc (NYSE:TWTR) is scheduled to report earnings on Super Thursday before market open, with an EPS forecast of $0.14 on $699.94 million revenue.

In each of the past six quarters the company’s earnings beat consensus estimates (above). However, that didn’t stop the stock from plunging over 20 percent, descending into bear territory after Twitter warned investors to expect a drop in user numbers as it cleans up its platform and deletes fake accounts. This announcement came after Twitter had reported, during its Q2 earnings release, that it had missed analyst projections of its user growth by one million users.
As well, verifying account credibility is neither simple nor quick to carry out, something all social media giants are currently confronting. Just today, Twitter made headlines when it locked Tesla Chief Executive Elon Musk's account, on mistaken suspicions of a hack. Twitter's efforts to purge their platform of trolls, bots and other fake tweeters has caused investors to lose faith in the company’s most important metric. It also makes it difficult to predict future user and profit growth.
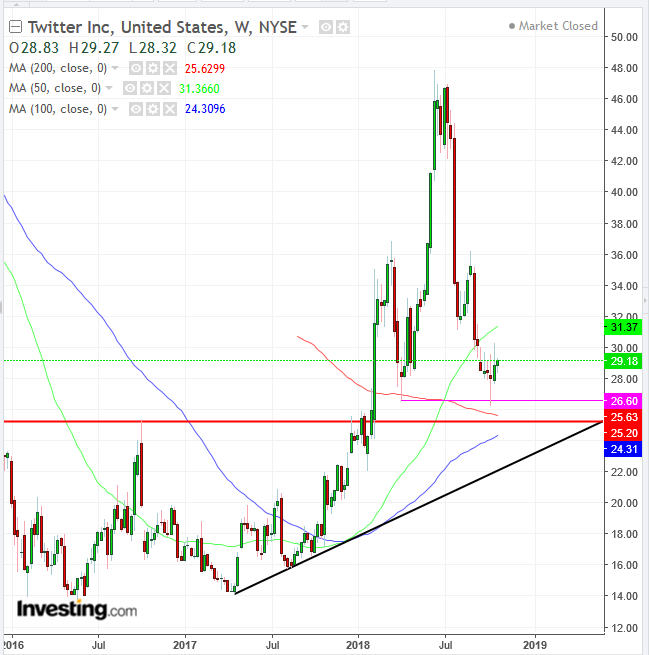
Despite all this, after shares plunged 40 percent drop since the June high of $48, the stock may have become a bargain. Indeed, it's currently showing signs of a potential bottom.

The stock found support when demand outpaced supply at the $26 level (thin, purple line), the April 2018 trough, right atop the $25 key figure. That was the October 2016 peak, which formed the neckline of a massive double bottom.
That would also be nearing the long-term uptrend line since April 2017. The price also found support above the 200 DMA (red), after the 50 DMA (green) crossed above it, triggering a “golden cross,” demonstrating current prices are superior to previous ones. Also, the 100 DMA (blue) is rising, set to cross the 200 DMA and make the same case.

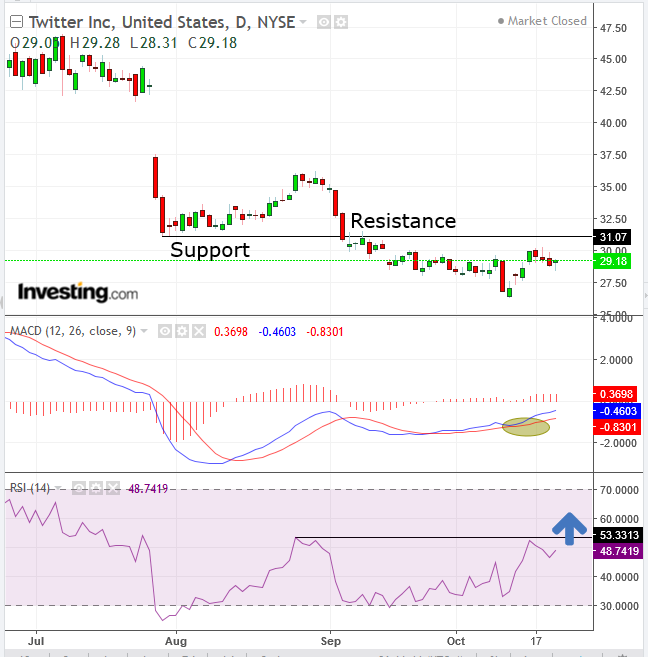
The MACD curved up from a decline, with its shorter MA overcoming its longer MA, producing a buy signal. The daily RSI provided a positive divergence when momentum rose in late July to September, while price action fell. An RSI cross above its 54 level registered late August would provide its buy signal.
Trading Strategies – Long Position Setup
Conservative traders should wait for a new, rising trend to establish, with 2 minimum, ascending series of peaks and troughs.
Moderate traders would wait for a close above the late August trough with signs of consolidation. That can be signified with at least one long, green candle following a red or small candle of any color.
Aggressive traders may risk a small position, with a short stop-loss, or hold on for a long-term position. A close above the psychological $30 would strengthen the case for a bottom, as it would be the highest close since September, and spur the RSI to form a new peak above 54.
Trade Sample 1 – Short term
- Entry: 31
- Stop-loss: 30
- Risk: 1
- Target: 36
- Reward: 1:6
Trade Sample 2 – Medium term
- Entry: 31
- Stop-loss 30
- Risk: 1
- Target: 47, June peak
- Risk-Reward Ratio: 1:16
