Verizon Communications (NYSE:VZ) is set to report Q3 2018 earnings on Tuesday, October 23, before market open. As popular Mad Money analyst Jim Cramer says, the major communications services company has “decent growth with good yield.”
The company is expected to post EPS of $1.19, which would be a 21.43 percent jump from the same quarter last year. Revenue consensus for Verizon is $32.49 billion, up about 2.6 percent year-over-year.

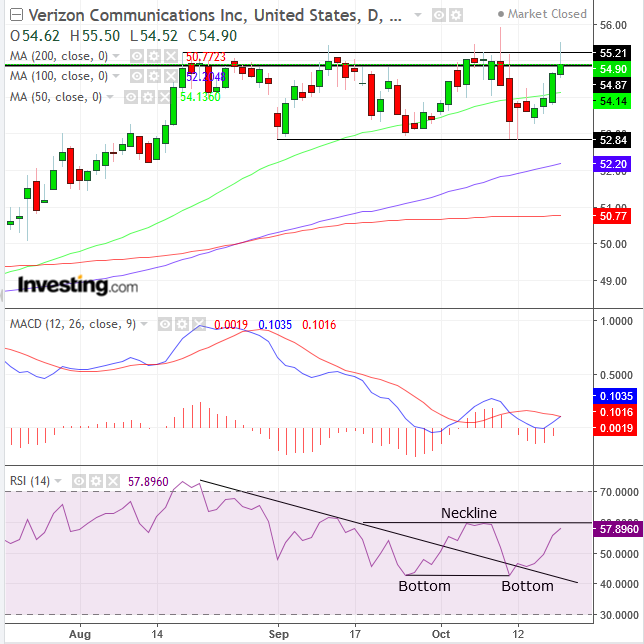
Shares have been trading within a 4 percent range since mid-August. That means that an earnings surprise might be followed by a violent move, should the price break out of its roughly $52-$56 range, as stop-losses are triggered (on a downside breakout) or a short-squeeze occurs (with an upside penetration).
Readers should note that the range top coincides with the early February peak (thick black line), revealing that traders consider that price level significant. Will it be broken? Indicators suggest it will.
The price move that led to the range coincided with the moving averages executing a golden cross, when the 50 DMA (green) crossed over the 200 DMA (red), in an indication of superior performance by recent price data. Since then, the 50 DMA has been supporting prices, as the 100 DMA (blue) climbed to support the range bottom.
The RSI demonstrates that while the conception of the range was coupled with a falling momentum, it has since broken to the upside, in what may turn into a bottom line for momentum, should the RSI cross over the 58 mark. Should that happen, the MACD will provide a buying signal as well, when it’s shorter MA (blue) overcomes its longer MA (red), projecting an outlook for continued rising prices, as reflected by the superior performance of shorter major moving averages relative to longer ones.
Trading Strategies
Conservative traders should wait for a decisive upside breakout, following a minimum three percent penetration, to filter out a bull trap. A close above the $57 would be safer. Some investors employ a time filter as well, such as three days. Then, conservative traders would wait for a return move to retest the support of the range top, manifested with at least one long, green candle engulfing a preceding red or small candle of any color.
Moderate traders would wait for a minimum two percent penetration, followed by a return move, either to confirm the pattern’s integrity or for a closer entry to minimize risk.
Aggressive traders may hazard a long position with a one percent filter, then wait for the return move, either for trend confirmation or an entry closer to support.
Very aggressive traders may enter a contrarian short position, relying on Friday’s shooting star as confirmation of the range top resistance. Although a potentially risky trade, it provides a high risk-reward ratio, especially if waiting for an entry closer to the shooting star’s high price as bulls test that ceiling.
- Entry: $55
- Stop-loss: $55.50
- Risk: $0.50
- Target: $52.50
- Reward: $2.50
- Risk-Reward Ratio: 1:5
