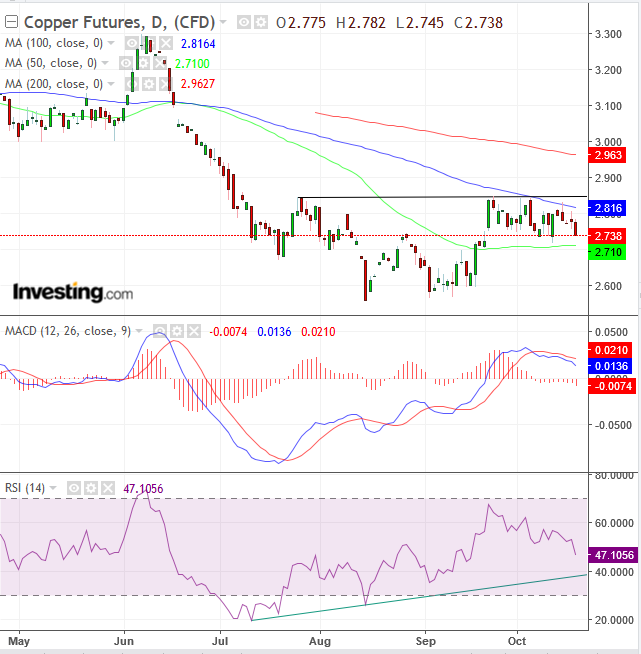
Copper prices have been trading aimlessly for the past few weeks. However, a broader view reveals that the metal may have been forming an H&S bottom over the last three months. This development is appropriate after copper fell by more than 22 percent since June, when the labor dispute at the world's largest copper mine, Chile's Escondida, was settled, bringing an end to further supply disruptions.
However, there may be another, less conspicuous factor at play that's affecting the supply-demand shifts evident on the chart. There are signs of massive copper stockpiling by China.
It appears that the hoarding of the red metal started at the end of March, which curiously (or perhaps not so curiously) coincides with the beginning of the US-China trade war. There have already been reports of China stockpiling other commodities such as grain, gold and oil. It seems likely that China's long historical memory of 19th century Western colonial humiliation is playing a part in the country's current behavior. Now that the Asian country has openly declared plans to become the world's biggest superpower within the next 30 years, basic materials are a key component if their economic initiatives are to succeed.
Could all this have rubbed US President Donald Trump the wrong way, provoking him to take on China in a head-to-head trade battle on a global scale? We can't say definitively, of course, but if it's true that China is stockpiling copper as well, there will be a sharp decline in demand when it stops. Meanwhile, however, if the price completes an H&S bottom, it should trigger a short-squeeze and increase trader demand.

Copper has rebounded from its August 15 low of 2.562 to its peak of 2.846, reached on September 24. A higher price would complete an H&S bottom, establishing a trend upwards.
The 200 DMA often appears at the point of reversal, as we see it falling below 3.000 toward the neckline. We also see the 100 DMA mark another level of supply, as it crosses below the neckline, weighing on prices since the recent peak, the right shoulder of the pattern. Meanwhile, however, the 50 DMA has been providing support.
The RSI signals a positive divergence, as it has been rising, while the price has been falling, between the July low of 2.674, forming the left shoulder, and below 2.600, forming the head.
The MACD offers a sell signal, going against our thesis, but it's noteworthy to remember that since it measures the relationship of different price averages, it is a lagging indicator. The RSI, on the other hand, measures the different momentums for the prices, and since momentum shifts typically precede a price move, it is a leading indicator. Therefore, more conservative traders might wait for lagging indicators to confirm leading ones, while more aggressive traders are willing to increase the risk for higher potential rewards.
Trading Strategies – Long Position Setup
Conservative traders should wait for the price to cross over the 200 DMA, currently 4 percent above the neckline. Another resistance may be the 3.000, round psychological number.
Moderate traders may be content with a 2 percent penetration above 2.9000, as well as a return move to the neckline for a closer entry to allow a minimum 1:3 risk-reward ratio until the 200 DMA, in case it continues to form a resistance.
Trade Sample:
- Entry: 2.850, on a correction from 2.900
- Stop-loss: 2.840
- Risk: 0.10
- Target: 2.900
- Reward: 0.50
- Risk-Reward Ratio: 1:5
Aggressive traders may enter after a one percent penetration.
Trade Sample:
- Entry: 2.875
- Stop-loss: 2.850
- Risk: 0.25
- Target: 2.950
- Reward; 0.75
- Risk-Reward Ratio: 1:3
