Contrary to popular belief, trading gold isn't simple. It doesn’t just go up when investor sentiment turns risk-off or when the dollar is falling. The same holds true in the reverse—risk on sentiment and/or a strong dollar don't necessarily weigh on gold.
As August winds down, gold is set to complete its fifth straight monthly drop, something that hasn't happened in five-and-half years, since the period from October 2012-February 2013. While gold's current decline is set against a strengthening dollar, the backdrop for the previous such fall was against a mostly flat dollar.
For analysts keeping track of supply and demand for physical gold, using it as a reliable indicator to predict the next move, the price of gold plunged 30 percent from October 2012 till July 2013 despite record demand for physical gold, especially in Asia. For traders who reflexively take an opposing position to their dollar outlook, the USD’s advance during the 30 percent gold plunge was just a modest 4 percent.
So, why did gold lose a near-third of its value both then and now? John Hathaway, Chairman of Tocqueville Gold Fund, attributed the earlier plunge to derivative markets, which were over 92 times the size of the underlying physical market at the time. As for now, many are blaming Bitcoin for attracting demand away from gold. Says Hathaway, that's “baloney."
Rather, it would appear that gold has had everything going against it:
- Investors remain risk hungry, as indicated by US equities which continue hitting new records
- Even when they turn fearful, traders rallied to the dollar for security, and
- Favorable US interest rates which are set to continue rising have boosted the dollar, even when markets are risk-on
Traders continue to second guess the trend, fearing it could reverse. It could. But since trading is a probability-based business, the odds are always with the trend.

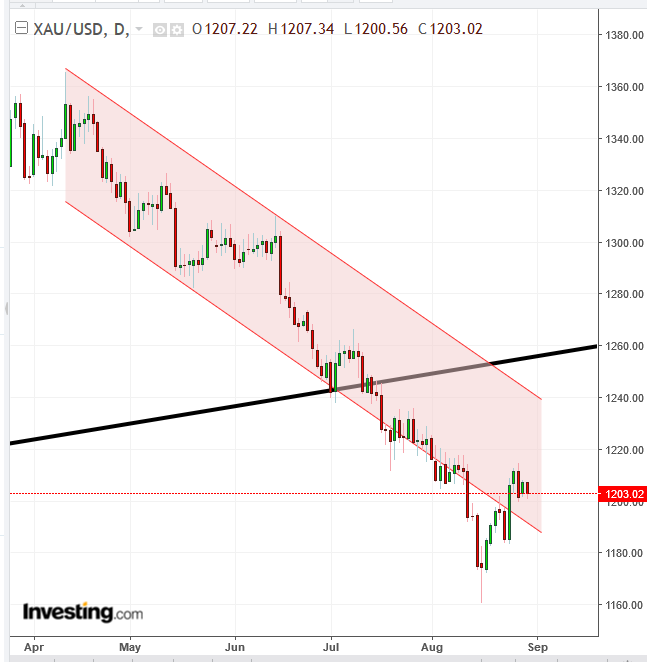
The price of gold has been falling since April, when it entered a descending channel. The psychology of this pattern is a market agreement that the asset is overvalued, which is why sellers aren't the not only ones pushing down prices by agreeing to sell at respectively lower price. Buyer support is stumbling too, as they continue to accept seller's rates, albeit at ever lower prices.
However, in our descending channel, up until now, buyers have reduced support even further, once the price fell below the uptrend line since December 2015. Note that prices have traded below the channel, since buyers didn't bid them back upto the channel top.
Finally, prices fell almost 4 percent below the channel, reaching a low of almost $1,160. The roughly 4.5 percent rebound Tuesday, to nearly $1,215, was forced lower by selling pressure at $1,220, a support/resistance level August 2.
Today's second decline increases the outlook that gold will be unable to scale back to the channel top, suggesting the channel bottom will become its new resistance, the place on the map where sellers take over the supply-demand balance.
Trading Strategies – Short Sell Setup
Conservative traders would wait for a new trough, beneath the $1,160.56 low posted August 16.
Moderate traders may wait for the price to fall below $1,180, back below the descending channel
Aggressive traders may risk a short now. Note, the $1,200 psychological level could provide support.
Trade Sample
- Entry: $1,199, after a close below the psychological round number, $1,200 support.
- Stop-loss: $1,201, above the round-number support
- Risk: $2
- Target: $1,185, above the August 23-4 support.
- Reward: $14
- Risk-Reward Ratio: 1:7
