Investing.com’s stocks of the week
Speculators in Treasury futures are currently holding record short positions on longer term bonds, ahead of next month's FOMC meeting, betting on continued rate hikes as well as the US economy easing back from last quarter's GDP high of 4 percent. On Friday, Jeffrey Gundlach, founder of DoubleLine capital, tweeted:
Massive increase this week in short positions against 10- and 30-year UST markets. Highest for both in history, by far. Could cause quite a squeeze.
The official SEC Investor Bulletin explains, exhaustively, why the price and yield possess a negative correlation. In brief, the lower a bond's cost the broader the difference between the price and the eventual payout, thereby inflating the yield.
Since traders are betting that global turmoil will not deter the Fed from its upward course for interest rates, in order to attract buyers, bond prices would have to be cheap enough to allow for a higher yield in the new, higher rate environment. Still, Gundlach believes that traders are unjustifiably bearish.
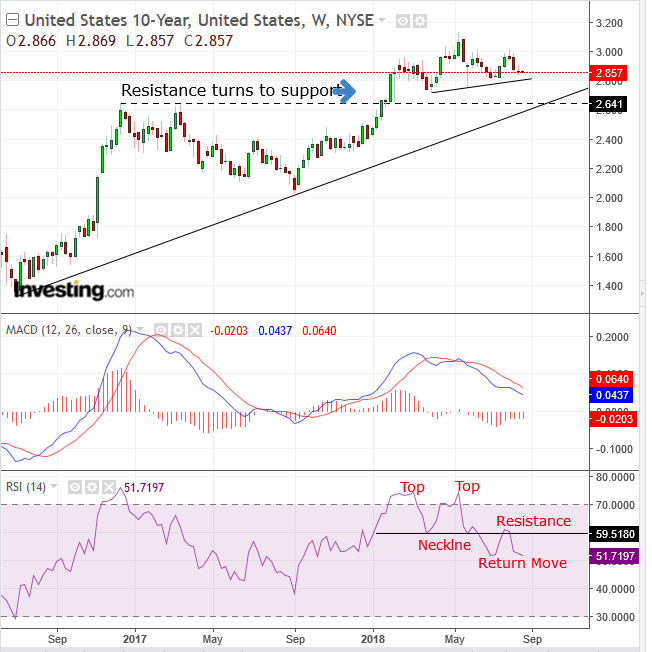
What might the 10-year Treasury chart's technicals signal?

The first thing that jumps out is that the yield in August failed to resume the uptrend in order to climb over the May 3.00 percent peak, opening the possibility of an H&S top. As well, even if yields fall below the lows forming the neckline, it would still be well above the long-term uptrend line since July 2016. In other words, a decline may be only a short-term correction within the uptrend.
To reconcile the conflicting outlook between a bona fide top and a minor setback for yields, we looked at the MACD and RSI to understand the current price, by comparing different price averages (MACD) and the intensity of the price movement relative to previous action (RSI). Both have provided sell signals.
In March, the MACD's shorter MA crossed below its longer MA, well ahead of May's decline in yields. The RSI delivered a negative divergence when momentum fell between the May peak and July's activity; while the price remained above the lows since April, the momentum crashed, completing a double top, with a return move that proved its integrity to boot.
The perspective of more recent price-sets weakening compared to longer averages, including earlier prices, compounded by falling momentum, increases the outlook for declining yields.
The question is whether they would fall hard enough below the uptrend line. The neckline meets the uptrend line at 2.82, according to the current angle. The first sign of a reversal would be when the previous peak resistance – turned support, once crossed, flipping market psychology – of 2.64 would be violated.
Trading Strategies – Short Position Setup
Conservative traders may wait for a trend resolution, for either a long position after the May peak is bested or for a short position after the September trough would be violated.
Moderate traders would wait for the uptrend line to break.
Aggressive traders may short upon the yield crossing below the uptrend line.
