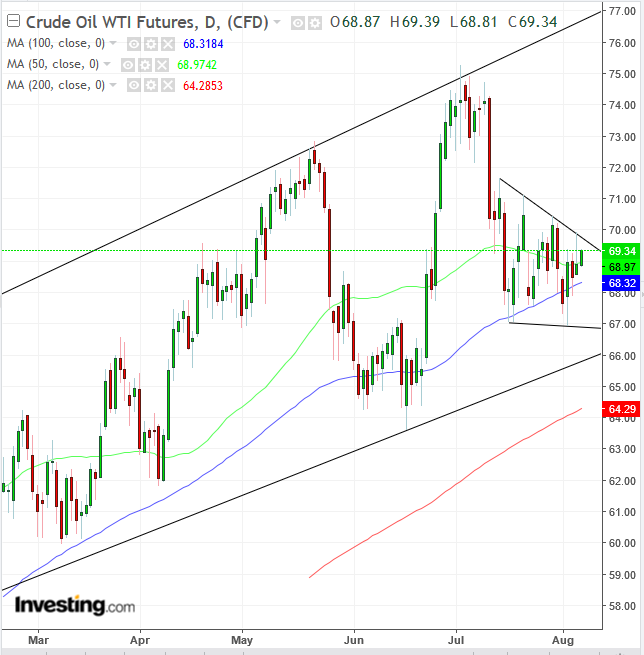
The oil market is facing a lot of influences on the geopolitical front. The price of WTI started to edge lower after hitting $75+ levels in early July, leaving analysts wondering whether the commodity will resume its climb anytime soon or whether supply will continue to exceed demand and finally reverse the trend.
Dan Eberhard, CEO of drilling-services company Canary, is betting on the former case, forecasting oil prices will hit $100 a barrel by the end of the year, a 45% percent spike. He listed the following drivers:
-
OPEC countries' inability to significantly increase supply, despite their public pledges. The group of oil producers struggled to ramp up its June-July supply by 1-1.2 million barrels a day.
-
The U.S. reimposed economic sanctions on Iran, a move that could eventually wipe out an estimated 1 million barrels a day from the global market.
-
Venezuela's production dropped from 2.2 million barrels a day two years ago to 1.34 million barrels today, and is expected to shrink further to 1 million barrels a day at the end of the year.
-
Synchronized global growth is forecasted to boost aggregate demand by 1-1.2 million barrel per day.

After trading within a rising channel since February, the prices have been consolidating within a descending channel since late July. The pattern demonstrates that supply has been absorbing demand, and an upside breakout would signal that sellers are willing to lower prices to find willing buyers.
Note the location of the pattern development on the chart, above the uptrend line and channel bottom. It demonstrates the significance of a downside breakout as a potential game-changer, a trend reversal.
The 200 DMA (red) is rising to provide support to the channel bottom and today the price climbed above the 50 DMA (green, which is itself rising upon the potential support, near the top of the 100 DMA (blue).
Trading Strategies
Conservative traders would wait for a trend resolution, with either a peak higher than the July 4, $74.76 level, to extend the uptrend or with a peak lower than the June 18, $63.95 level, with two descending peaks and troughs.
This means they would wait for either a decisive upside breakout of the triangle or a downside breakout of the rising channel. A successful return move would need to follow, confirming the flipping market dynamic. The channel's top would turn from resistance to support, with at least one, long green candle engulfing a preceding red or small candle of any color; the channel’s bottom would turn from support to resistance, with at least one long, red candle covering the preceding green or small candle of any color.
Trade Example – Long
- Entry: $71, above yesterday’s shooting star and psychological round number
- Stop-loss: $70, the key round number support
- Risk: $1.00
- Target: $75, below the July 3 $75.27 peak resistance and psychological round number
- Reward: $4.00
- Risk-Reward Ratio: 1:4
Trade Example – Short
- Entry: $66, below the rising channel’s support
- Stop-loss: $67, above the rising channel’s resistance
- Risk: $1.00
- Target: $63, above the descending triangle's target
- Reward: $3.00
- Risk-Reward Ratio: 1:3
