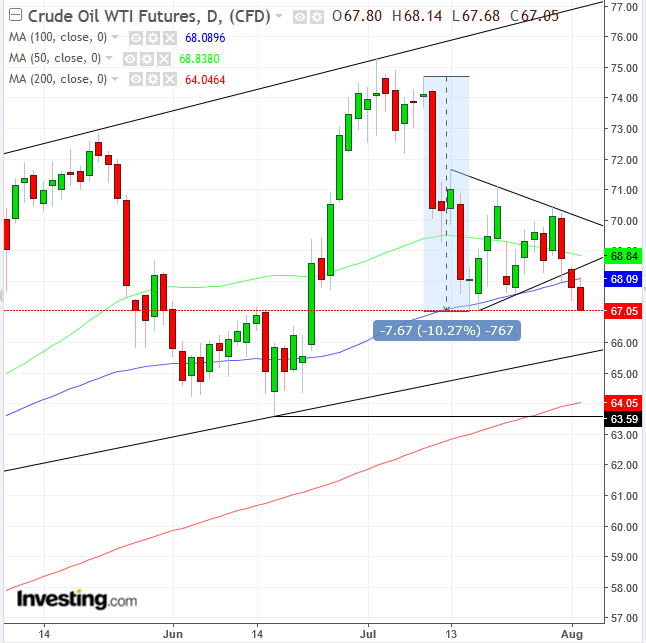
Oil prices are under pressure following a suprise rise in U.S. stockpiles and the technicals of the chart indicate more selling to come.
Crude oil traded lower after the Energy Information Administration reported a surprise 3.8 million weekly leap in crude inventories on Wednesday, while the strengthening U.S. dollar also weighed on the commodity’s dollar-denominated contract.
While investors try to guess where the black gold market is headed next, amid re-surging oversupply worries and trade jitters likely to affect global demand, the current technical chart suggests further selloffs.

The decline extended a downside breakout of a pennant pattern, bearish after WTI prices plunged 10% in just five sessions. The psychological makeup of the consolidation is that of profit-taking after a big move and of a wait-and-see approach to gauge which way prices will swing. The downside penetration signals that traders are prepared to resume the selling.
Note the alignment of the major moving averages, which underline supply-demand pressure points. The 50 DMA (green) marked the supply-demand balance in the very center of the pattern. The 100 DMA (blue) moved along the buyers’ “line-in-the-sand,” tracing the pennant’s bottom. The 200 DMA is rising toward the bottom of the rising channel since February, as the next major bullish stronghold, before the final support, by the preceding June 18 trough, posted at $63.59
Trading Strategies
Conservative traders would wait for an official, by-the-book, reversal, upon an established downtrend, with two descending peaks and troughs.
Moderate traders may be content with a close below the June trough.
Aggressive traders may short now, providing they accept the risk of trading against the trend, with an appropriate equity management strategy that provides a higher risk-reward ratio than the minimum 1:3. After that, they might risk a long position after prices fall to the channel bottom, 200 DMA or the preceding trough.
Trading Examples
Short Entry: $68
Stop-loss: $69, pennant resistance
Risk: $1
Target: $64, above the June trough
Reward: $4
Risk-Reward Ratio: 1:4
Long Entry: $66, channel bottom support
Stop-loss: $63, below June trough support
Risk: $3
Target: $75, July peak resistance
Reward: $9
Risk-Reward Ratio: 1:3
