The Turkish lira plunged to its lowest on record as the central bank held rates, leading many investors to question its independence.
With inflation accelerating to an annual 15.5% last month, analysts had expected a rate hike, despite pressure from President Recep Tayyip Erdogan, who has stood staunchly against higher rates.
Since the last hike on June 7, the lira has fallen about 6%, further fueling inflation. That was the third increase since April to counteract high inflation and an ailing currency.
Now, investors fear a currency crisis and the technicals are only likely to confirm the trend.

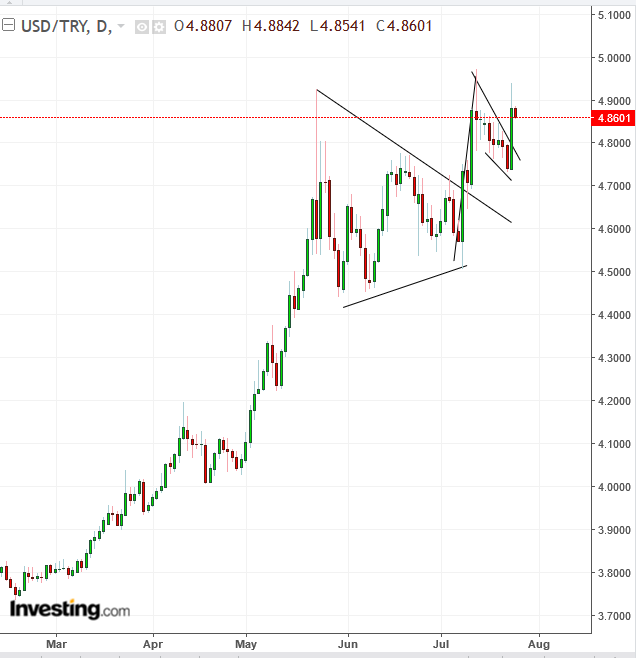
The dollar broke topside of a falling flag versus the Turkish lira. This is a second, consecutive bullish pattern, following the July 9 upside breakout of a symmetrical triangle.
A symmetrical triangle provides a visual presentation of an equal battle between bears and bulls. The upside breakout demonstrates that all supply has been absorbed within the boundaries of the pattern and buyers are willing to bid up prices to find willing sellers.
This presumably sets up a technical chain reaction, which includes a short squeeze, forcing bears to add to the demand side of the equation, to return their loaned contracts; it also prompts the triggering of longs above the pattern, as traders prepped positions in case of an upside breakout; finally, it favors encouraged bulls and discouraged bears to convert to form a cycle that propels prices higher.
As bulls take-profit and the new, available supply momentarily pushes prices lower, they form a return-move, which traders consider a return move to the pattern, as they wait to see that the pattern integrity holds.
The return-move within a confined range formed a flag. In what appears counter-intuitive, a flag sloping against the trend holds potential for a rally to follow, as profit-taking dominates short-term trading, as old bulls retrench, and new comers enter the market and carry the trend higher. Like with the symmetrical triangle, the flag's upside breakout demonstrates that all supply has been absorbed, and demand is bidding prices higher in search of new supply.
The second, consecutive bullish pattern confirms that bulls are in charge. This supports the fundamentals of rising inflation and mounting political influence over monetary policy decisions.
Trading Strategies
Conservative traders may wait for a new all-time high of the USD/TRY as confirmation for the continued weakness of the lira, followed by a return move to the flag, to verify its support, with at least one long green candle engulfing a preceding red or small candle of any color.
Moderate traders may wait for a new all-time high to continue the uptrend but not necessarily for a return move, and if they do, it would likely be for a better entry, rather than evidence of its integrity.
Aggressive traders may enter a long now, providing they accept the risk of a return move to the flag and set up their stop-loss according to their equity account management.
