Home Depot (NYSE:HD) is expected to report earnings this morning, before the bell, with a $2.06 EPS forecast on a $25.23 billion revenue. However, the unofficial 'whisper' on Wall Street is that we should be expecting an EPS of $2.11.
The US has seen an especially wet winter – among the ten wettest in the past 124 years. This is likely to dampen the company's report for the first quarter. However, the silver lining is that this means there is the likelihood of a big uptick in home improvement projects in the near future.
This view is supported by the Joint Center of Housing Studies at Harvard University, which has predicted that home remodeling is expected to remain strong and steady into 2019. The estimate is that home improvements and repairs will reach about $337 billion in 2018, up 7.1% from estimated 2017 spending. A surge in remodeling permits suggests homeowners are increasing the number and the size of their home projects.
Today, global stocks including US futures took a decisive downturn, flipping off the risk-on switch with a bang. This comes as a number of events add fuel to the geopolitical fire. The first is the eruption of violence in the Middle East. Additionally, trade worries still weigh on investors after Trump's attempt to help China's side of the trade spat was retorted with a backlash by lawmakers from both sides of the aisle. Lastly, the synchronized global growth narrative is being challenged again by a slowdown in China and Europe.
Should the downturn of US futures follow through into their underlying gauges, they may weigh on shares of Home Depot as well, irrespective of its earnings. A miss due to the harsh winter, spurring a short-term selloff, would only exacerbate a broader risk-off sentiment. This may provide a buying dip.
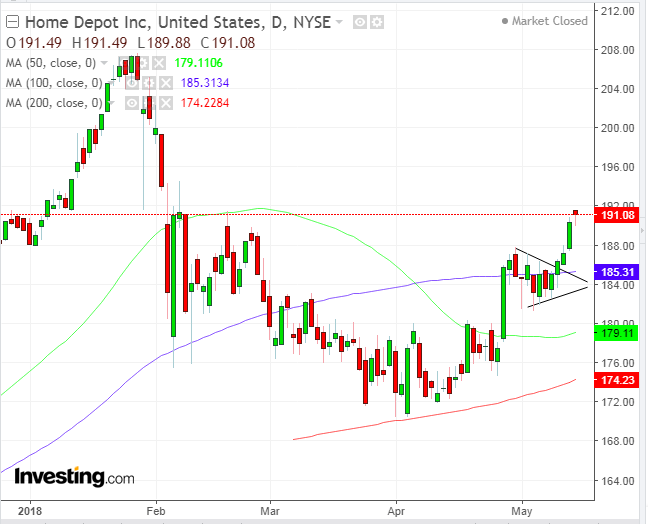
The late-January broader selloff dragged shares of Home Depot down from $207.60 record high to a low of $170.42, posted both on April 2nd and 4th. The rebound from that low was on top of the 200 DMA (red), expressing the fact that investors might have considered it a bargain. Since then, the prices decisively crossed over the 50 DMA (green) on April 26, after encountering its resistance for five straight sessions.
The climb above it was the biggest one-day jump this year, with a near-5 percent advance. That really solidified the flag-pole of a pennant, a continuation pattern, or a bullish pattern after a sharp rally. The upside breakout included a crossover of the 100 DMA (blue).
Should prices fall, they may find a support for the $185.00 pennant area.
The pennant's flag-pole ranges from $174.55 till $187.80, implying a $13.25 target.
Trading Strategies
Conservative traders would wait for a full return move to retest the pattern's integrity with at least one green candle engulfing the preceding red candle. This would occur after the 3 percent penetration since the upside breakout satisfied a conservative filter to avoid a bull trap.
Moderate traders would wait for a return move for a better entry but not necessarily to retest the pennant's support.
Aggressive traders may enter a long position immediately, providing their account can withstand a whipsaw back to the $185 area or absorb a loss.
Equity Management
Stop-Loss: $184
Target: $198
Therefore, the entry should allow the target to afford a potential reward three times that of the risk.
Example:
- Entry: $187
- Risk: $3
- Target: $197
- Reward: $9
- Risk-Reward Ratio: 1:3

