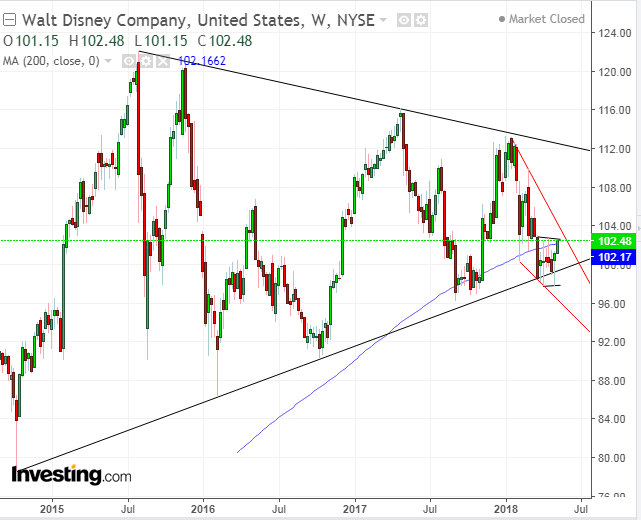
Disney's (NYSE:DIS) stock has been ranging for the past three years at around $100 a share or a $150 market capitalization. It is also 3.5 percent down from its last earnings report.
Morgan Stanley has reiterated its stance to stay overweight on Disney, reasoning that its strategic reorganization and pending deal to acquire the entertainment division assets of Twenty-First Century Fox (NASDAQ:FOX) will set the stage for a global, over-the-top, direct-to-consumer business, generating $6.5 billion in fiscal 2020.
That was the right call until this morning, when Reuters reported that Comcast (NASDAQ:CMCSA) is putting together a $60 billion, all-cash hostile bid for Fox's assets. Since this was previously thought to be a sure thing, we expect conference call questions later today when Disney reports Q2 2018 results after the close.
Comcast is only expected to make the move if the U.S. government approves AT&T's (NYSE:T) acquisition of Time Warner Inc (NYSE:TWX). Comcast's funding efforts are also expected to affect a bid that Comcast has made for the UK's Sky, which Disney is also bidding to acquire. As well, questions are also expected regarding updates on the success of Disney's recent launch of the direct-to-consumer service, and the cord-cutting impact on summer bookings for theme parks which is Disney's second-biggest division by revenue.
The global entertainment giant is currently enjoying revenue from a number of recently released blockbusters, including Avengers: Infinity War, the Black Panther as well as anticipating additional success from the end-of-May release of Solo, a prequel to Star Wars.
The options market is implying a move of 2.5 percent post-earnings in either direction.
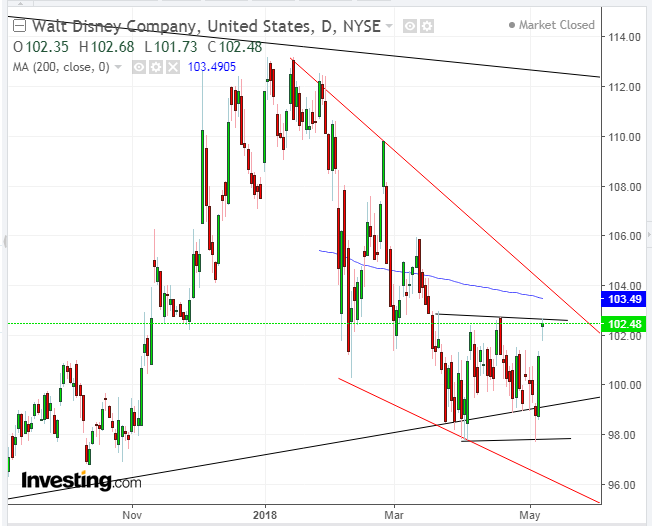
We can see in the chart, the three-year congestion is reaching an inflection point. The price is retesting the top of a range since mid-March as well as the 200-week MA. Should it successfully overcome those dual resistances, it would increase the probability of an upside breakout of a bullish falling wedge, to retest the top of the 3-year symmetrical triangle, in which both supply and demand are inching toward the middle.
What is remarkable is that the price is below the 200-day MA at the same time that it's retesting the 200-week MA. That rare alignment may suggest the critical support/resistance implication of the price level under $104: (1) 200-week MA, (2) 200-day MA, (3) rectangle (range) pattern since mid-March, falling wedge top – all on top of the bottom of a 3-year converging range.
To conclude, should the $104 level be breached on a closing basis, it would have overcome multiple resistances, providing proportionately multiple buy signals.
Trading Strategies – Long Position Setup
Conservative traders would wait for the upside breakout of the falling wedge, followed by a 3 percent penetration as a filter to avoid a bull trap at about $106.50. Then, they might wait for a return move to retest the wedge top, with at least one long green candle enveloping a preceding red candle.
Moderate traders may wait for the 105.00 level to be breached to include a filter to avoid a bull trap. Then, they may wait for a return move for a better entry, but not necessarily for proof of the mid-term uptrend.
Aggressive traders might be happy with a 1.00 percent penetration on a closing basis of the falling wedge.


