For a second day now, the dollar is heading lower, after US President Donald Trump has once again gone on the offense, accusing Russia and China of manipulating their currencies. These are the same two countries with whom he is already engaged in a trade war, with the potential of a real war with Russia still existent after Saturday’s attack in Syria.
Viraj Patel, a currency strategist at ING Groep NV in London characterized Trump’s accusation as “another implicit signal of the administration’s desire for a weaker US dollar – especially against major trading partners.” Patel forecast that “these weak dollar expectations will remain entrenched in currency markets, especially if the administration continues its mercantilist policy focus.”
Patel is referring to President Donald Trump’s statement in a Wall Street Journal interview on January 17, 2017 that the “too strong” dollar is “killing us.” Following those remarks, his Treasury Secretary nominee, Steven Mnuchin, repeated the same outlook to Senators, who were about to confirm the nomination. Additionally, after his confirmation, Mnuchin kept in line with the same rhetoric.
Earlier this year, Mnuchin repeated the statement that a weaker dollar would provide short-term benefits for the US. This sent the forex market into a frenzy.

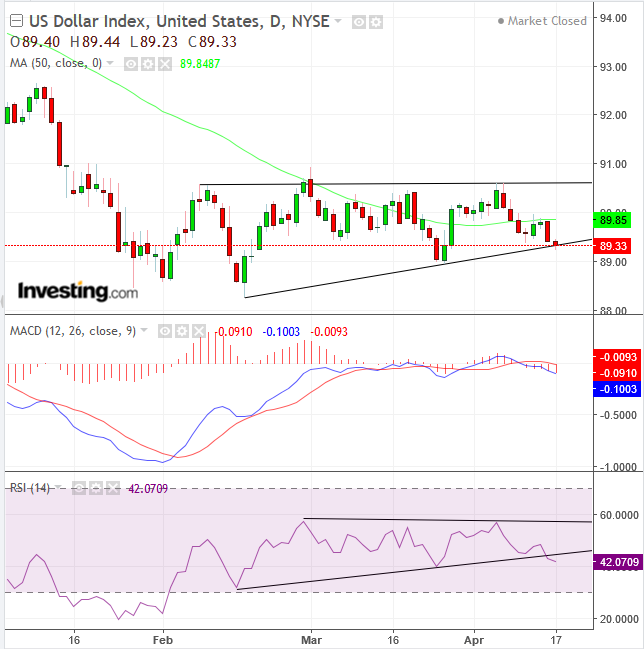
The supply-demand tug-of-war over the Dollar Index formed a pattern in the shape of an ascending triangle, clearly demonstrating that bulls are advancing on the bears. The bulls were buying in mid-February at the 88.00 levels; in late March they were still willing to invest at the 89.00 levels. They were, however, only willing to sell consistently above the 90.50 level since early February.
The outlook for the ascending triangle is bullish because, should the trading pattern persist, buyers will have absorbed all available dollars at these levels, requiring them to bid the greenback higher to resume buying.
Additionally, today’s decline penetrated the lower boundary of the pattern but is now back above it, providing an exceptionally attractive risk-reward ratio for a long position.
However, there are also bearish signs, demonstrating that the market is not necessarily on board just yet. On Thursday, the price penetrated the 50 dma but closed beneath it. It did so again on Friday.
Yesterday, the price fell 0.45 percent below its resistance, closing at the bottom of the session. Both the MACD and the RSI provided sell signals, when the MACD’s short MA crossed below its long MA, demonstrating that recent prices are weaker than previous prices; the RSI fell below its own ascending triangle, the momentum of that of the price action, suggesting the price may follow below the bottom of its pattern as well.
Trading Strategies
Conservative traders would wait for a decisive 3.00 percent penetration, closing above the pattern, signaling a bottom. Then they’d wait for a likely return move to retest the pattern’s integrity, with at least the real body of one green candle engulfing the prior red candle's real body. This would strengthen the case that a bottom has been completed.
Moderate traders would be satisfied with a 2.00 percent breakout. They may wait for a return move for a better entry, but not necessarily for a support confirmation.
Aggressive traders may enter a long position immediately, with a stop-loss below the day’s low. The price sitting at the very bottom of the pattern provides an exceptional risk-reward ratio, even just to the 90.50 pattern top. Of course, patient traders who are willing to wait for an upside breakout would see their profits potentially triple, while risking some of their existing profits, of course.
