The renewed and reinforced US sanctions against Russian billionaires connected to the Kremlin and their companies sent Russian assets across the board into a free fall including its currency, shares and bonds. The sanctions which were announced on Friday, and are in response to Russia's alleged meddling in the U.S. elections and more recently its involvement with Syria's civil war after the country's President Assad authorized alleged chemical weapon attacks against a rebel stronghold in Syria. The measures pose a threat to Russia's already fragile economy.
The Russian ruble fell today for a second day, losing a combined value of almost 10 percent on an intraday basis. It has settled at an almost 8 percent loss, at about 62.6.
Yesterday's 4.27 percent slide was its worst since January 2016, according to the Moscow Times and today's fall was the worst during trading hours, with a decline of 5.3 percent. As of 6:20 EDT, the ruble is down 3.65 percent against the dollar.
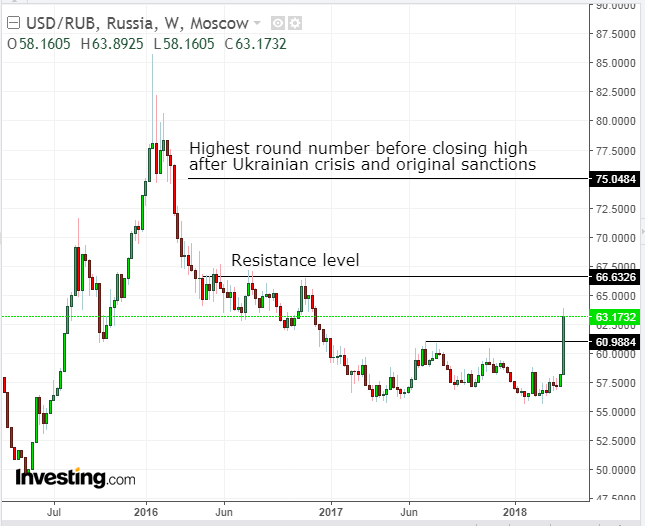
Today's tumble against the dollar resulted in an upside breakout of a double-bottom for the USD/RUB pair.
Confirmation for a further decline for the ruble may be seen in its one-month volatility. It leaped 2.6 percent, the most since May, to 11.9 percent, which is second only to the South African rand, only 80 basis points above. The notoriety of being the second most unstable currency in the world, with the potential to top the list will scare investors further away from any Russian assets, exacerbating the selloff.
Trading Strategies – USD/RUB Long Position Setup
Conservative traders would wait for a formal trend reversal from down to up. The February 26 low and current high must produce a higher low, to be followed by a second higher high, completing an ascending series of rising peaks and troughs for a bonafide uptrend.
Moderate traders might be satisfied with the formation of a base above the double-bottom neck line (if not for an unlikely return-move to the neckline) both to confirm support of the new uptrend, as well as for equity management purposes. They would place the stop-loss beneath the base.
Aggressive traders may now enter a long position, provided they can afford a stop-loss far below the current price, below the round, psychological number of 60.00, beneath the neckline or of the potential loss.
Equity Management
Stop-Losses (Below Provided Parameters):
1. 60.98 – neckline
2. 60.00 – round psychological number
Targets (Below Provided Parameters):
1. 65.00 – implied double-bottom's target, based on height
2. 66.50 – April-November 2016 resistance level
3. 75.00 – round, psychological number and last round number before the top on a closing price basis, after the Ukrainian crisis.
There are many trading strategies available for the same instrument in the same time. A trader must establish a plan, which would include his resources and temperament. This is crucial and determines success or failure.
Pair entries and exits should provide a minimum 1:3 risk-reward ratio. They should suit your time frame, with the understanding that the further the prices, the longer it will take to achieve them. Finally, understand that these guidelines are probability-based, which means by definition they include losses on individual trades, with the aim of profits on overall trades.

