Investing.com’s stocks of the week
Financial markets are structured around risk. When optimism rises, investors seek growth, but when pessimism takes hold, investors’ prime objective is preservation. Fear is a more powerful motivator than greed, as we are programmed for survival.
Therefore, it stands to reason that the yield’s slump to a 7-week low, potentially topping out – as investors rotate out of growth assets and into government security – is a flaming red flag for equities.

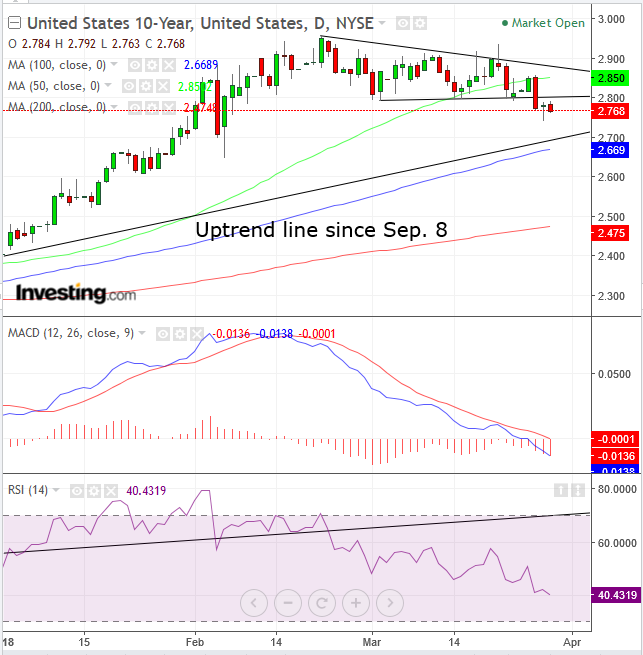
10-Year Treasury yields may have topped, after completing a Descending Triangle on Tuesday, which demonstrates demand over eagerness. (Normally, this pattern reflects the supply over eagerness, but yields fall as demand for their bonds rise.) The pattern’s supply dominance is expected to resume in the new, lower levels, implying a 2.64 target. The downside breakout occurred after the price retested the 50 dma (green) after crossing below four sessions prior, which has been supporting the price since September 18.
However, the uptrend line since September 8 – guarded by the 100 dma (blue) – is still intact. A close below the 2.7 level would strengthen the case for a reversal.
Still, both the MACD and the RSI have provided negative divergences, peaking ahead of the price, mid-February for the MACD lagging indicator and the beginning of February for the RSI leading indicator.

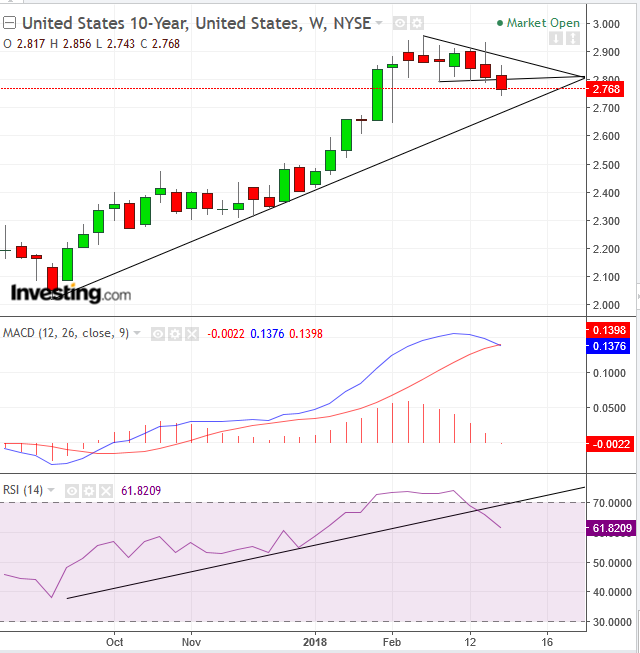
While the RSI at 40 may be nearing oversold levels, on the weekly chart it just topped out from a 74-oversold level. Moreover, the MACD is providing a sell signal right now, with the shorter MA (blue), crossing below the longer MA (red).
Trading Strategies
Conservative traders would wait for a confirmation of the trend reversal, when the price falls below the long-term uptrend line and successfully retests it, with a red candle covering the preceding green candle.
Moderate traders might wait for a confirmation of the Descending Triangle’s integrity, when a return move is thwarted by the triangle’s bottom.
Aggressive traders may short now, with a stop-loss above the 2.8, triangle bottom.
