Until recently, cryptocurrencies were considered by many as the sure and easy way to riches. Now they have been taking a beating. Yesterday, we reported Harvard economist and former IMF chief economist Kenneth Rogoff’s saying Bitcoin has no future, due mainly to regulations. This followed a barrage of regulators and investment firms talking down the digital asset. Today, the BBC is resurfacing a Bitcoin theft worth $6.23 billion that took place back in 2014. The stolen Bitcoin have just been discovered at rival exchange BTC-e. This may be adding to investors’ gloom, as cryptos keep falling.

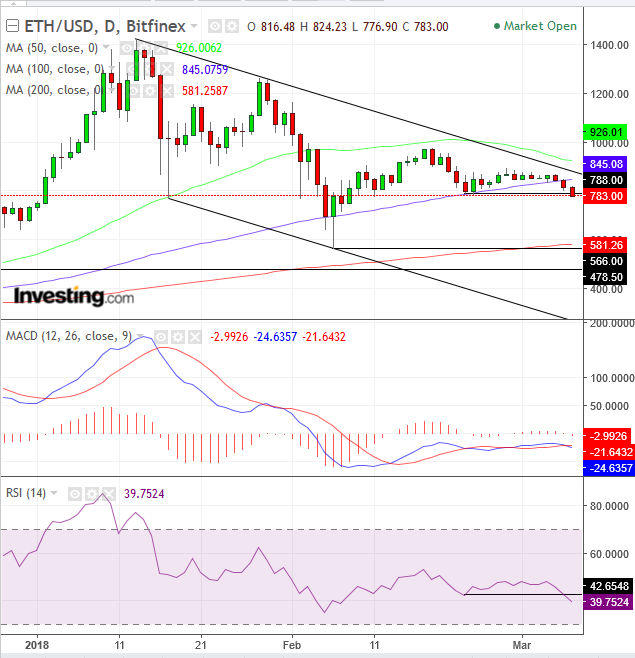
Technically, while digital currencies trade within a falling channel, Ethereum is weaker than Bitcoin. While it is 12.65 percent higher than its February 25 low, Ethereum already crossed below its February 23 low. While BTC managed to near its February 20 high by 0.7 percent, ETH came at its highest, February 27, 9.4 percent below its February 18 high.
While Bitcoin is still above its 50 dma, after it crossed above it on March 1, Ethereum never managed to cross back over it, after it fell below it on February 2.
While BTC’s MACD and RSI have yet to provide sell signals, ETH’s MACD’s short MA crossed below its long MA ad and RSI dipped below its February 22nd low to correspond to its price’s falling below its corresponding trough.
Once the February 22 low is cleared, there is no technical support until February 6. Note that the 200 dma (red) aligned itself with that level, in demonstration of its significance in the supply-demand balance.
Trading Strategies – Short Position Setup
Conservative traders would wait for a trend confirmation when a trough registered lower than its former, on February 6, with the low price of $566.
Moderate traders may wait for a return move toward the falling channel top, for a closer entry, at around $880 per the current angle, and eliminate whipsaw risk.
Aggressive traders might be content with a close that is lower than the February 22, $788 low, together with the MACD and RSI signals to support an immediate short, providing they are prepared for a volatile return-move, in terms of stop-loss or capital risk.
Equity Management
Stop-loss (above provided levels):
- $845 – 100 dma
- $880 – falling channel top
- $926 – 50 dma
Targets (above provided levels):
- $581 – 200 dma (red)
- $566 – February 6 trough
- $492 – a November 24-December 22 support/resistance
In this trade, even the most conservative (furthest stop-loss and closest target) combination provides better than a 1:3 risk-reward ratio.
$845 stop-loss provides a $43 risk according to the current entry price of $782. A target of $581 provides a $201 potential reward, providing almost a 1:5 risk-reward ratio.
There are many trading strategies available for the same instrument in the same time. A trader must establish a plan, which would include his resources and temperament. This is crucial and determines success or failure.
Pair entries and exits should provide a minimum 1:3 risk-reward ratio. They should suit your time frame, with the understanding that the further the prices, the longer it will take to achieve them. Finally, understand that these guidelines are probability-based, which means by definition they include losses on individual trades, with the aim of profits on overall trades.
