Conflicting Fundamentals
Oil is stuck between conflicting fundamentals – some positive and others negative. There are currently three major fundamental catalysts holding the price of oil in a vice grip.
First, oil's price rose on fears that supply from Libya’s El Sharara, the country’s largest oil field, will be interrupted due to protests against pollution.
Additionally, the International Energy Agency (IEA) just issued a warning that investments by oil producers into exploration and production have been neglected, which will result in a potential lack of supply after 2020. This news is positive for oil as it continues to drive up its price.
On the negative side for oil, global markets are gripped by the threat of a trade war. Should President Donald Trump follow through with his rhetoric, it may cause substantial interruption in the financial system, potentially hampering global economic growth. Arguably, even if the President doesn't follow through, investors may seek safe havens and shy away from growth assets, which in itself may slow economic growth. A slower economy produces less demand for oil.

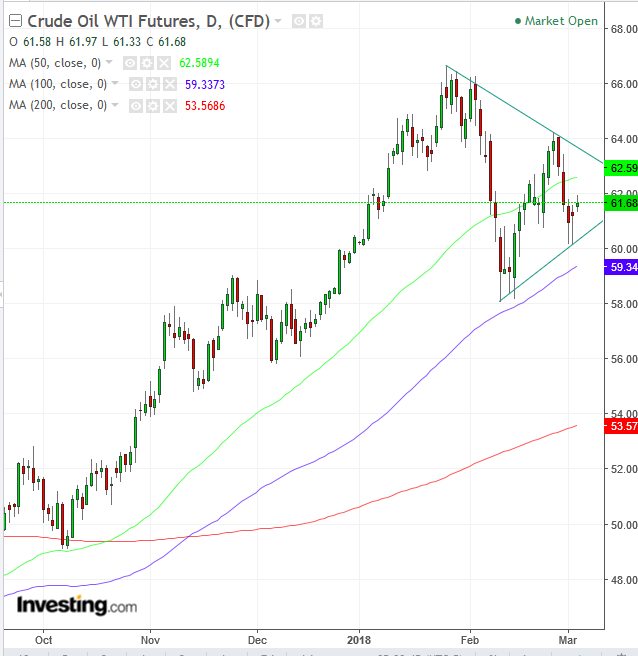
The price of oil has fallen below its uptrend line since September 31, 2017, but found support at $58, a price where traders have been invested since November, from where prices rose 15 percent (something traders would love to enjoy again) in the two-and-a-half months until January 5, moving above $66 a barrel.
Shifting Supply-Demand Balance
Oil's price falling below the uptrend line since September also crossed below the 50 dma (green). Both technical gauges demonstrate that the supply-demand balance has shifted from an uptrend, in which demand overcomes supply, to consolidation—a period of profit taking and soul searching on the value and/or sentiment of the oil market.
The price bouncing off the $58 support-resistance support level also included the support of the 100 dma (blue). Both technical gauges demonstrate where demand has shifted (previously above the uptrend line since September and 50 dma).
Note that the 200 dma (red) reveals the next potential shift in the supply-demand balance, as it retraces the uptrend line since June 21, 2017.
Supply-Demand Equilibrium
This price equilibrium plots a Symmetrical Triangle, demonstrating equal motivation among bears and bulls. While the uptrend provides a bias for a resumption of rallies (since more and more traders have become invested in the rally since September 2017) a downside breakout would likely flip their allegiance. Therefore, a decisive upside breakout is required for a continued uptrend. An official downtrend would be established should the price fall below $58, forming a second lower trough, completing two successive peaks and troughs going down.
Trading Strategies – Long Position Setup
Conservative traders should wait for a fresh peak above $66.66 registered on January 25, to reaffirm the uptrend.
Moderate traders may be satisfied with a decisive upside breakout of the symmetrical triangle. Filters are employed to avoid bull-traps, including price depth, a close above the triangle and time holding onto the breakout. The top of the triangle may be considered a support for a stop-loss. Return moves toward the triangle occur about twice as much as not.
Aggressive traders may risk a long position now, with a stop-loss beneath the triangle and beneath the $60 round psychological number, with a target of the triangle-top at around $63. Alternatively, they may hold on for the potential upside breakout.
