Bitcoin is rising for a second day, perhaps on another “Pizza Day.” The first Pizza Day occurred back in 2010 when crypto trailblazer “Pizza-Guy” Laszlo Hanyecz successfully bought two pizzas for 10,000 Bitcoin, which at the time was worth about $40, but is worth a staggering 107 million dollars by today's Bitcoin value. Yesterday, Hanyecz was at it again and this time purchased two pizzas for 0.00649 Bitcoin or $67. He successfully completed the transaction using the Bitcoin Lightning Network which allows businesses to process Bitcoin payments cheaply and quickly. While it’s very exciting, there are still a lot of technical issues to solve, such as the need for a bi-directional payment channel which every buyer-seller pair would have to set up. This is currently neither convenient nor cheap.

Either way, the price is rising for a second day nearly 12 percent from the $9,500 level, where it closed on Sunday. Perhaps traders are bedazzled by Bitcoin's rise since the original Pizza Day on May 22, 2010, when one Bitcoin was worth $0.0041, from where it rose 2.6 million percent to its current $10,670 rate. The reminder of this jarring change over the past eight years may serve for some as a good omen for another such ridiculous rise in value.
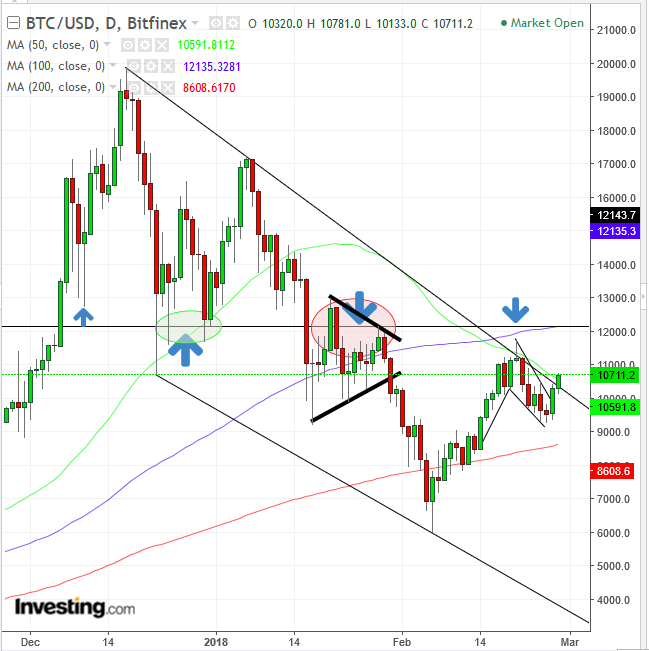
The excitement may have completed a bullish Falling Flag, whose upside breakout is retesting both the 50 dma (green) and the upper bound of its falling channel, whose upside breakout may suggest a reversal in the making, which would be complete when a second peak would be posted, above the February 20, $11,760 peak. Note, that the February peak is a shooting star, which marks the spot where supply overcame demand. Indeed, the price fell more than 20 percent, down to $9,284.3, posted on February 25.
The presumed supply of the shooting star is highlighted by the 100 dma (blue) – where, incidentally, also the 50 dma was at the time – and the fact the price closed below the falling channel-top. Note, that the 200 dma (red) is below the flag. The positioning of the major MAs suggests there is a rift between the former bullish outlook, represented by the 200 dma and the more recent outlook, represented by the 50 dma and 100 dma. The question is whether the 200 dma represents a long-term bullish view or former view.
Finally, the $12,000 price level has demonstrated a line-in-the-sand between bulls and bears since December. Between December and February, the price level proved a resistance. However, since mid-January, it became a level marked by resistance which ultimately became dominated by bears, after the January struggle between bears and bulls was decisively won by bears. Bears took the digital king a few notches down all the way to $6,000 which became a presumed resistance level, where supply would overcome demand.
So, what of the bullish Falling Flag’s upside breakout? Well, it’s tricky. A flag is a continuation pattern. Its completion suggests a continuation of the prevailing trend. However, as we’ve continuously pointed out, Bitcoin is within a downtrend. Would a Falling Flag, bullish within an uptrend have the same impact in a downtrend? Probably not. The impetus provided by a flag is the ongoing bullish psychology formed by an uptrend, in which more and more traders join it and therefore prolong it. Think of it as a kinetic train. The more people jump on it, the faster it goes.
The bottom line is an upside breakout of the $12,000 price level would overcome its presumed resistance – created by sellers rushing to sell, remembering the last time the price got here, and got knocked all the way down to $6,000, the 50 dma, potentially the 100 dma, and, most of all, the former peak, completing a rising series of peaks and troughs, culminating in an uptrend. On the other hand, a close back beneath the downtrend line/falling channel-top, compounded by the psychologically important $10,000 level would indicate a resumption of the prevailing downtrend from the December 17, $19,891 high.
Trading Strategies
Conservative traders would wait for resolution of the trend, either by a close above the $12,000 level for a long position, or a close below the $9,000 for a downtrend, which would clear out the flag and potentially the 200 dma.

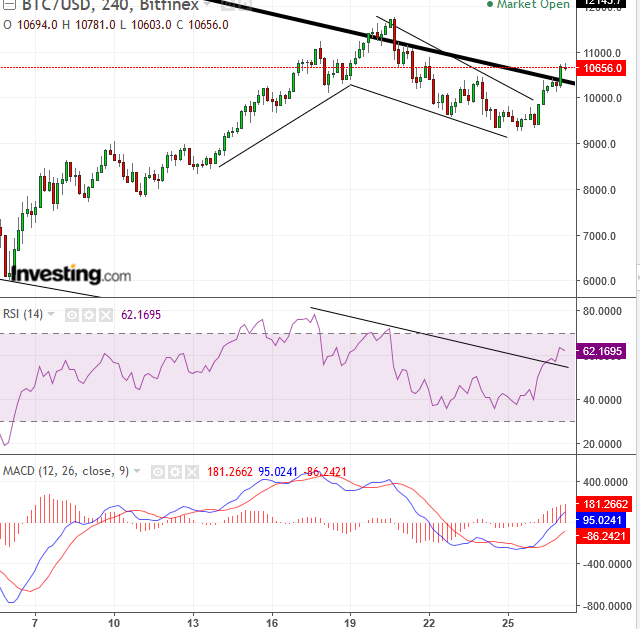
Moderate traders trade on the 4-HR chart, where both MACD and RSI provided buy signals, waiting for a likely return-move to retest the flag, at the $10,000 level, before entering a long position, place a stop-loss anywhere beneath the key level and as low as under $9,200, below the Sunday low. The target would be $11,700, the point where supply overcame demand exactly one week ago.
Aggressive traders may go long now, with a stop at least below the $10, 300 level, where the downtrend line/falling channel-top since December is currently located.
Equity Management
There are many trading strategies available for the same instrument in the same time. A trader must establish a plan, which would include his resources and temperament. This is crucial and determines success or failure.
Pair entries and exits should provide a minimum 1:3 risk-reward ratio. They should suit your time frame, with the understanding that the further the prices, the longer it will take to achieve them. Finally, understand that these guidelines are probability-based, which means by definition they include losses on individual trades, with the aim of profits on overall trades.
