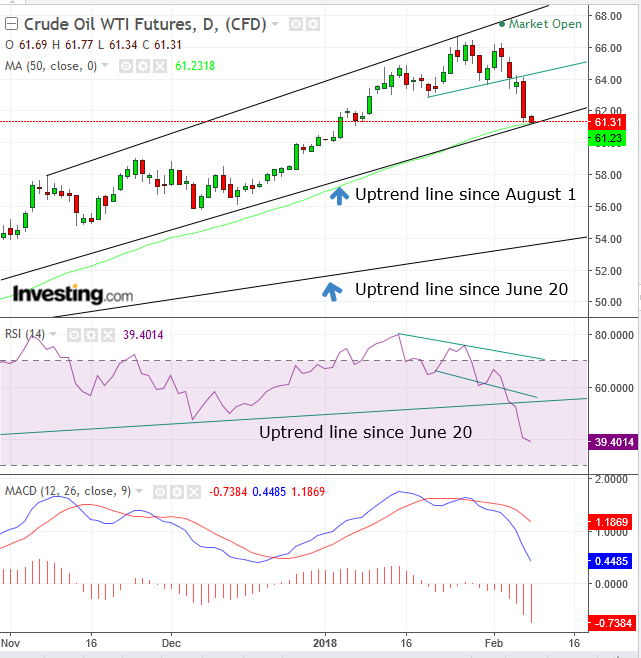
The price of WTI crude fell to $61.37, wiping out five weeks of gains, after data from the EIA showed a second consecutive weekly rise in crude inventory and record US production of more than 10 million barrels a day. In the same time, Forties, the North Sea’s largest crude pipeline, reopened after an outage on the previous day.
Additionally, a rising dollar is making it more lucrative for non-U.S. investors to sell dollar-denominated assets such as oil, in turn making these assets more expensive to buyers, which then reduces demand.
While these three catalysts seem to be perpetuating oil's fall, on the other hand, Chinese consumption of oil is rising, as reflected by the surge to a record 9.57 million bpd in imports in January, according to official customs data.
Investors are now asking themselves the following questions:
- How much of this selloff is psychological as a result of the record 10 million production? We always knew that day would come. Is it really a fundamental game changer?
- How much of the selloff is really due to a meaningless reopening of a pipeline, even the North Sea’s largest, after being closed for a single day?
- Is it possible that the rising Chinese consumption will absorb the increased US production?

The price has been displaying weakness since it failed on February 2 and 3 to climb higher than the January peak. The crossing below the uptrend line connecting the lows of January 19 and 31 may have completed a small H&S top. Either way, the implied target of that small pattern had been achieved, and while the price of oil has been falling, it found demand when it reached its uptrend line since August 31, 2017. As of 05:40 EDT, the price is right on the uptrend line.
Both the MACD and the RSI provided sell signals.
The MACD compares price data of different periods, and when the shorter MA (blue) crosses below the longer MA (red) it demonstrates that the current price is underperforming.
The RSI measures the strength of a price change via its momentum. The falling momentum from the oversold 80.00 condition within its top pattern, demonstrates an inherent weakness in price. Note the negative divergence. While the price pattern rose, with a possible up-sloping neckline for a small H&S top, the RSI top pattern was declining, with a down-sloping neckline equivalent. Finally, the RSI crossed below its uptrend line, not only for the same period of the price but even to an earlier uptrend line since June 20, 2017.
Trading Strategies
Long Position
Conservative traders would wait for a new peak above $66, to join the still-intact uptrend higher.
Moderate traders may risk a long position with a close above $64.00, wiping out the red candle’s bearishness.
Aggressive traders may risk an immediate long position, due to the exceptionally attractive risk-reward ratio, as the price is right on top of the support of the uptrend line.
Equity Management
Stop-Loss: Below $61
Targets: $65
Risk-Reward Ratio: 1:5
Short Position
Conservative traders would wait for a peak a trough lower than the January 25, $66 peak and current trough, to establish a downtrend, in which most of the market is bearish.
Moderate traders may wait for a 2-3 percent penetration of the uptrend line, with a close beneath it, followed by evidence the uptrend line turned to resistance with a long red candle’s real body covering a preceding medium-to-long green body.
Aggressive traders may sell with a close below the $60 key level.
