by Pinchas Cohen
Red Flag For Time Warner Investors
Perhaps the most repeated new phrase since the Trump campaign is "fake news". It's no secret that the US President doesn’t care for media companies, except for the reliably supportive Fox News. It is no surprise then that the Department of Justice is going after the AT&T (NYSE:T) - Time Warner (NYSE:TWX) merger, two media companies that aren't on President Trump's good side, claiming that the new entity would wield too much power and violate antitrust rules.
Given that this is the Trump administration, which seems to tenaciously cling to those pieces of legislation it most wants to see enacted regardless of how frequently said legislation may be shot down—consider the never-ending conflict over US immigration policy, a topic the White House refuses to give up on no matter how many times it's attacked in court—we might expect to see a drawn-out process contesting the DOJ's suite as well. Thus, until this is merger is put to bed one way or another, undoubtedly shareholders will be unnerved.

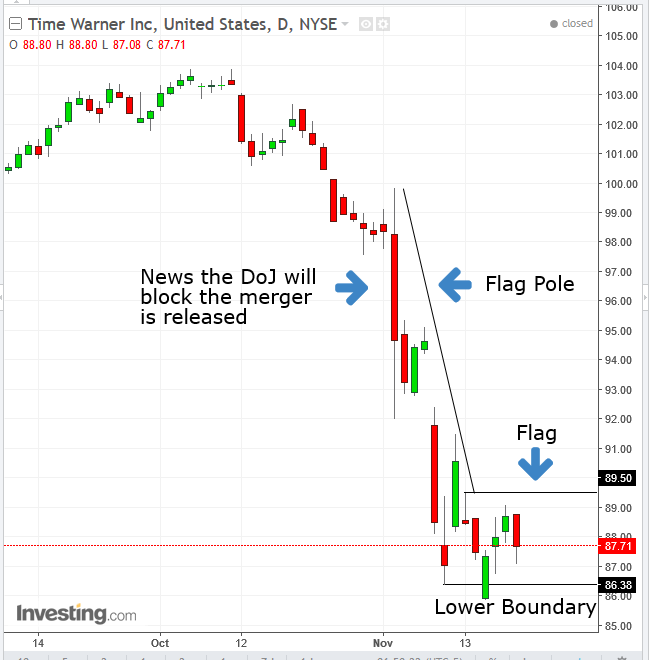
Shares of Time Warner fell as much as 6.45 percent and settled with a 3.75 loss on November 2, after the report that the DOJ would block the merger.
After three days of struggle between bears and dip-buyers, the price fell another 6.4 percent on November 8, followed by a third, 1.5 percent decline.
The overall plunge on the DOJ challenge to the merger was $12.05, or 12 percent, over as little as six trading sessions. It erased a full year of gains for the stock, which had been spurred by the Trump Bump, the post-election, animal spirits, stock market revival.
The extraordinarily sharp decline formed the “flag pole,” whereas the consolidation since the anniversary of the Trump victory formed the “flag,” which is a continuation pattern. When a downside breakout completes, it signals a repeat of the preceding move.
While the flag pole represents the panicked selloff, the flag represents profit-taking and a concern that the selloff was panicked, and therefore unsustainable. A downside breakout signals “here we go again,” which eggs on traders into the same emotional selloff as the one prior to the interruption by the flag.
Measuring The Target Price
Since the expectation is for a minimum of a repeated move, the target price is measured according to the length of the flag pole, from the November 2nd height of $99.85 to the November 9th low of $86.38, to a total of $13.50 from the flag bottom, forming the target of $72.88.
Stop-Loss
To give yourself a fighting chance, you’d need to get on the good side of statistics. That means cutting losses and running with wins, in contrast to what novice traders do, which is the single biggest reason for their failure. An acceptable risk-reward ratio is 1:3. Since the target provides a $13.50 reward, the stop-loss may be up to $4.50 above the entry point.
However, traders could get a more favorable ratio. Even if you're waiting on the conservative 3 percent penetration without waiting for a return-move for an entry closer to the pattern’s resistance, the risk is only $2.59, nearly half of the “allowed” $4.5 to satisfy the 1:3 risk-reward ratio. In other words, even with the most conservative breakout and the most aggressive entry (not waiting for the potential return move), the risk-reward ratio is 1:5. It increases exponentially in your favor the longer you wait for the return move to be fulfilled, bringing a potential entry to the bottom of the flag.
Trading Strategies
Conservative traders should hold on for a decisive 3 percent downside breakout from the flag’s $86.38 lower boundary, then wait for a likely return move to retest the flag’s resistance, and then wait for evidence of such resistance, with a close lower at least than the price action of the preceding up day, placing a stop-loss above the $86.38 level.
Moderate traders would wait for at least a 2 percent downside breakout and a potential return move, allowing for a better entry, with a stop-loss above the flag’s lower boundary.
Aggressive traders may enter a short position after a 1 percent downside penetration, with a stop-loss above the flag’s lower boundary. Waiting for a return-move, even for a partial one, would reduce the distance to the stop-loss and the depth of risk it carries.
