by Pinchas Cohen
Normally, a picture that may be murky from afar becomes clearer as the viewer advances toward it. Not so for dollar traders right now, who must form an opinion on the currency in an environment that only becomes more complicated with each passing day.
Multiple Headline Catalysts
The dollar began forming a reversal after congressional Republicans unveiled their broad principles for a tax reform plan on July 27. That was followed by the still ongoing investigation on whether the Trump campaign colluded with Russia for which, just recently, the first indictments from Special Counsel Robert Mueller were handed out.
The tax plan has also been under massive pressure amid mounting opposition from special interest groups. House Republicans ultimately postponed submitting the tax bill after they were locked up in a room for hours trying to eliminate opposition to changes to individual retirement savings and state and local tax payments. In other words, even if the tax bill were to make it to the floor, investors might not be as impressed with it as they originally thought.
A second potential catalyst is who will the President name as the next Fed boss on Thursday? The dollar got a boost initially from the hope-of-tax-reform rally when John Taylor, a known hawk, was considered to be the front-runner, but it fell when consensus said Jerome Powell, a dove, had taken the lead.
As well, the Federal Reserve is in focus for an additional reason. It's expected to keep rates on hold later today, while signaling an all-clear for a December hike.
Meanwhile, the greenback has been gaining versus major currency peers, to cap a second straight monthly advance, while gold has fallen for a second month.
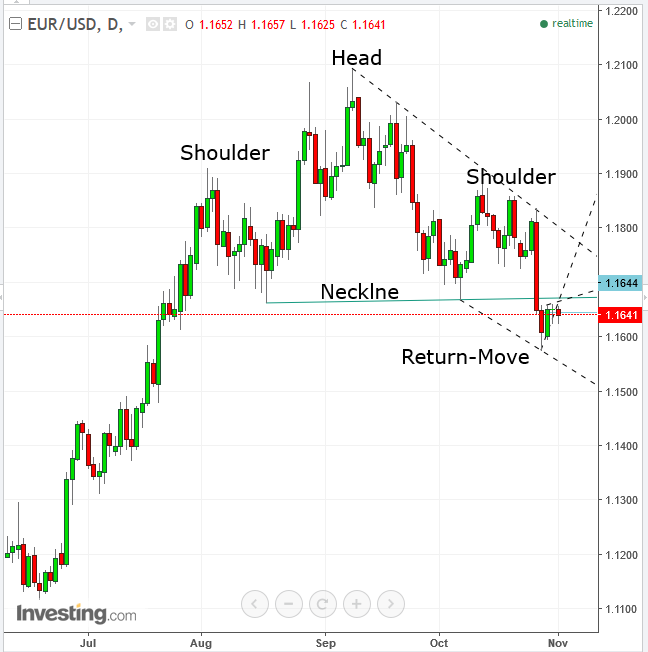
The dollar’s biggest currency peer, the euro, completed a top-reversal, in a mirror image of the dollar’s bottom-reversal. Yesterday, the euro slipped as regional data showed inflation unexpectedly slowed.
Scoping Out the Euro's Mirror Image

The H&S pattern formed by the EURUSD pair, visually represents how a buyer’s market trend turned into a seller’s market. The pattern completed when the price crossed below the neckline, which connects the former troughs, signaling a lower trough has been registered. However, traders beware, the above fundamentals provide ample opportunity for whipsaws and the neckline penetrated was a mere 0.8 percent, not even satisfying an aggressive 1-percent filter.

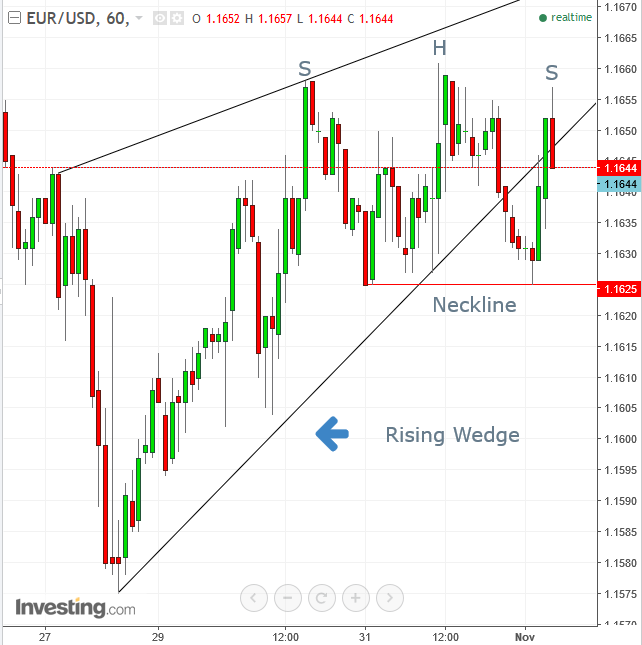
The return-move on the daily chart formed a Rising Wedge on the hourly chart, a bearish pattern which signifies an irrational buying frenzy before the market realizes it’s going in the wrong direction. There was a successful downside breakout, followed by a full return move, in which the pattern proved its resistance, suggesting the return-move on the daily chart may be over.
Trading Strategies
Conservative traders would wait for a 3 percent penetration from the H&S neckline, then a return move from that point, in which the pattern maintains integrity, signaled by a close below at least the last day of the rise of the return move.
Moderate traders might wait for at least a 2 percent penetration from the neckline, to avoid a bear-trap. They might wait for a return move as well, but not necessarily for the pattern to prove itself.
Aggressive traders might rely on the 0.8 percent penetration. Although it falls short of the 1 percent filter, they may rely on the downside breakout, followed by the successful return move, in which the bearish Rising Wedge on the hourly chart proved itself.
