Street Calls of the Week
Today, Germany’s GDP report showed a 0.6 percent growth in the fourth quarter, capping a 2.9 percent annual expansion. The positive German growth confirms two reports. The first is the European Commission’s declaration that the region’s expansion is the most balanced since the financial crisis. It also confirms the IMF’s raised global outlook for 2018. The region registered its best performance in ten years in 2017, signaling the ECB could soon proceed to reduce its balance sheet.

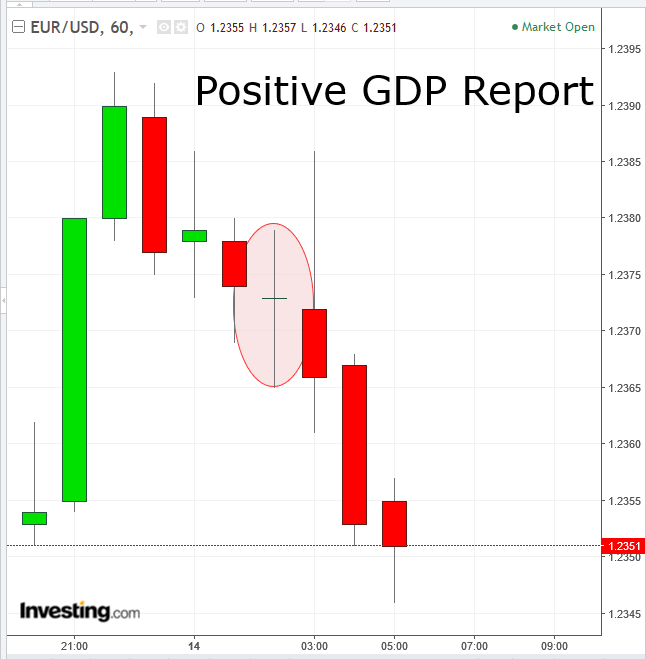
This would seem to imply that the euro should head higher. However, when I looked at the chart, fully expecting the euro to soar, I was surprised to see that while the release increased fluctuation, the euro resumed its decline.
So I checked the dollar chart. Sure enough, the greenback was taking off.

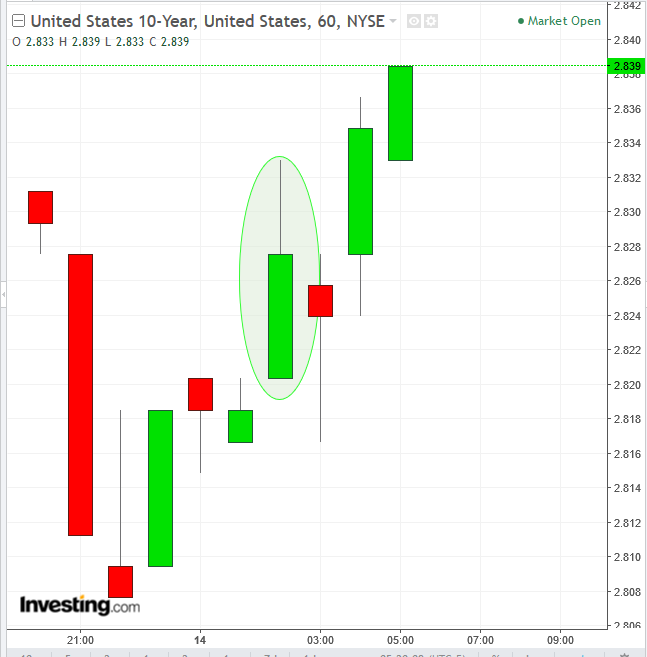
Only after referencing the 10-year Treasury yield did I realize the reason. Investors were selling US bonds. Ten-year Treasury yields gained one basis point to 2.83 percent, while Germany’s 10-year yield decreased two basis points to 0.74 percent, the lowest in more than a week.
Britain’s 10-year yield fell two basis points to .618 percent, and Japan’s 10-year yield dropped one basis point to 0.07 percent, the lowest in more than five weeks. US government bonds are underperforming their foreign peers.
Presumably, the selloff trigger is on anticipation of a faster pace to interest rates, widening an interest rate differential already in favor of the USD.

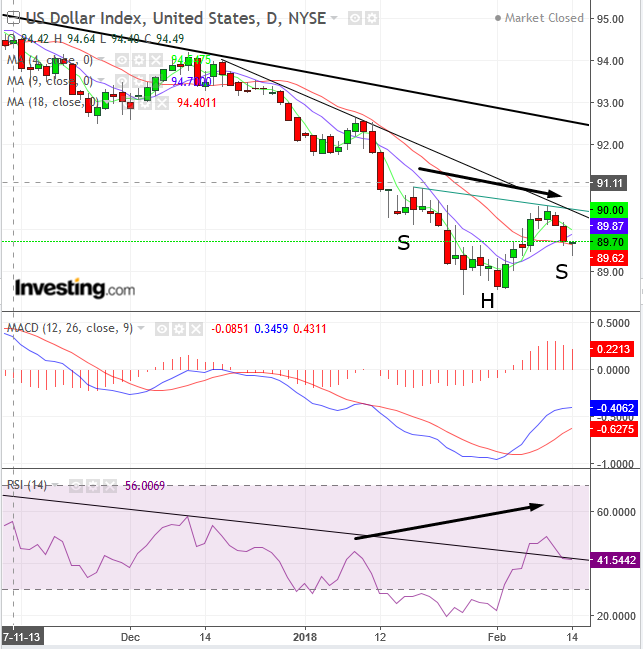
The dollar climb pared a 0.37 percent daily loss to under 0.1 percent, forming a bullish hammer. Should this hammer hold, it might form the right shoulder of a H&S bottom.
According to Cornelius Luca, author of Trading in the Global Currency Markets, a popular triple MA interplay is the 4, 9 and 18, for short term trading. The three are in a bullish formation, as the 4 (green) is above the 9 (blue), which is above the 18 (red).
The MACD, whose shorter moving average crossed above its longer one, suggests current prices are rising, providing a buy signal.
The RSI broke above its downtrend line, signaling a potential upside breakout of the price. Additionally, the momentum indicator provided a positive divergence when its February momentum advanced over the January momentum, while the February price fell lower than that of January. Since momentum leads price, it signals that price may follow higher.
An upside breakout of the H&S neckline, currently at 90.00, would coincide with crossing over the downtrend line since December 18, demonstrating the 90.00 as an intersection of supply and demand, which once crossed over, will turn northbound.
Trading Strategies
Conservative traders would wait for the most reliable of trend reversals, when two peaks and troughs would climb higher.
Moderate traders may wait for an upside breakout of the downtrend line since November.
Aggressive traders may enter a long position upon the upside breakout of the neckline/downtrend line since December 18.
