Chainlink's decentralized Oracle platform LINK token seems primed for high volatility as it edges closer to a breakout point.
Key Takeaways
- Chainlink has endured a month-long consolidation period without providing any clear signals as to where it is heading next.
- On-chain data shows that mid-sized whales have been selling or redistributing their holdings, adding credence to the bearish outlook.
- Only a daily candlestick close above the $29 resistance barrier could save LINK from a 43% correction.
Chainlink LINK looks indecisive from a technical perspective, but on-chain metrics suggest mounting downward pressure with little to no support underneath it.
Chainlink Consolidates Within Narrow Range
Chainlink continues consolidating without providing a clear outlook for where it is heading next despite the hype around Grayscale’s launch of a LINK trust fund for institutional investors.
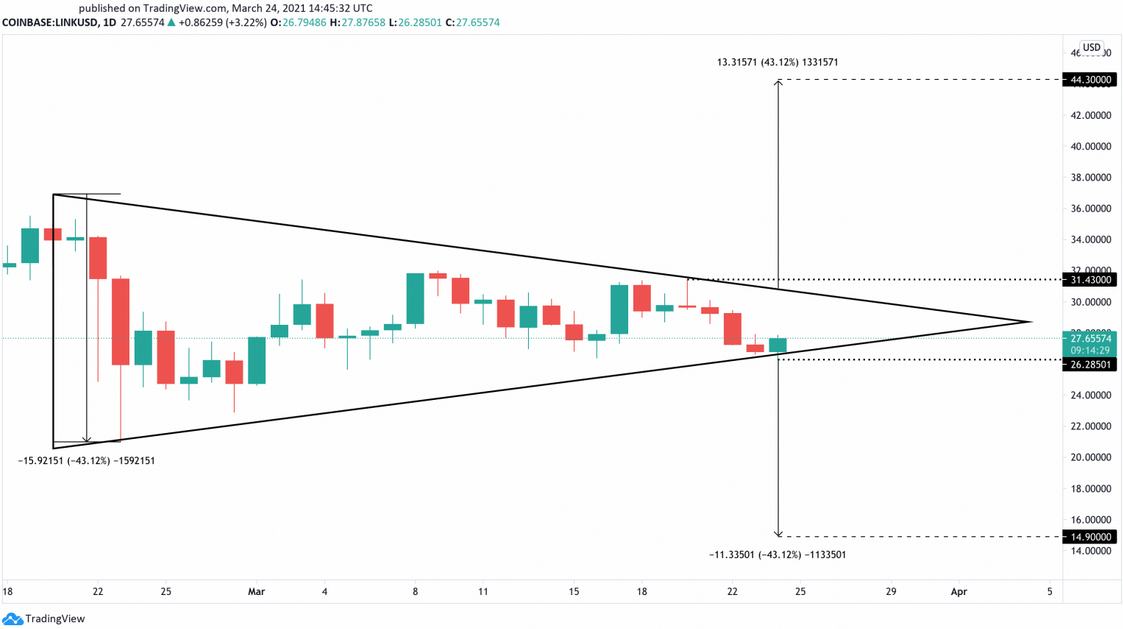
The decentralized oracles token has been making a series of lower highs and higher lows after peaking at an all-time high of $37 on Feb. 20. Such market behavior led to the formation of a symmetrical triangle on the daily chart.

As Chainlink edges closer towards the triangle’s apex, it signals that volatility is about to strike back. A daily candlestick close above $31.40 or below $26.30 would likely be followed by a 43% move in that direction.
This target is determined by measuring the height of the symmetrical triangle’s y-axis and adding it to the breakout point.
Whales Sell on Weak Support
Regardless of the ambiguity that Chainlink presents from a technical perspective, several on-chain metrics suggest that a steep correction is underway.
Santiment’s holder distribution chart shows that the selling pressure behind Chainlink accelerated over the past four days. The behavioral analytics firm recorded a significant decline in the number of addresses holding 10,000 to 100,000 LINK.
Roughly 100 whales holding $280,000 to $2.80 million worth of Chainlink have left the network or redistributed their holdings, representing a 3.50% decrease within such a short period.

While sell orders continue to pile up, transaction history shows that Chainlink sits on top of weak support.
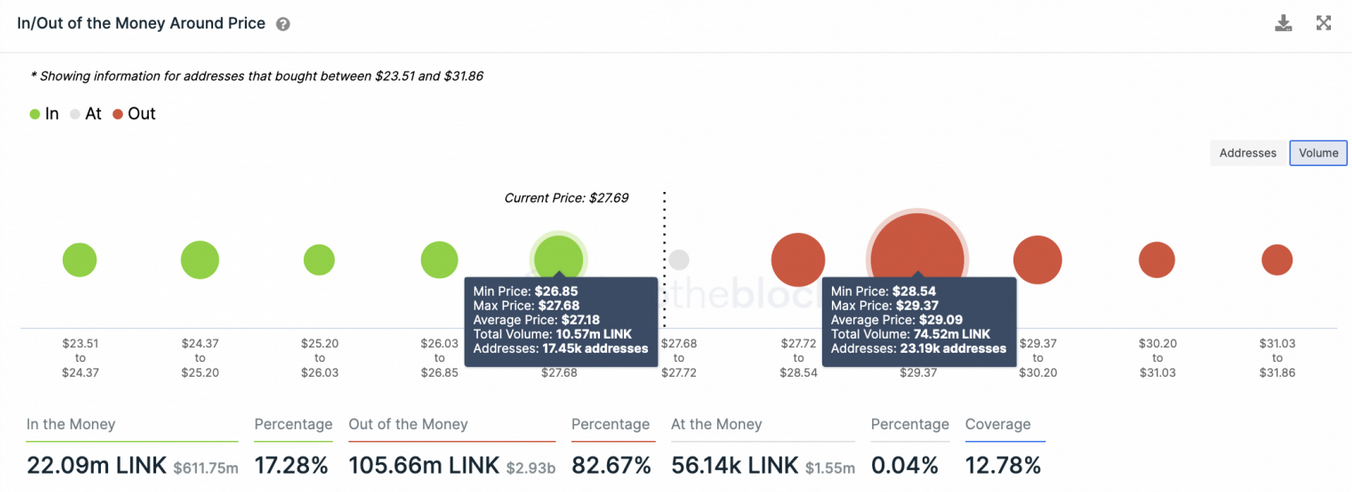
IntoTheBlock’s In/Out of the Money Around Price (IOMAP) model reveals no significant demand walls underneath this altcoin that will prevent it from dropping. Based on this on-chain metric, the only considerable interest area sits between $26.90 and $27.70.
Here, roughly 17,450 addresses had previously purchased nearly 11.60 million LINK.
Such a thin support barrier may not have the ability to absorb some of the selling pressure seen recently. If Chainlink can slice through this hurdle, it would likely reach the symmetrical triangle’s target of $15.00.

The IOMAP cohorts also show that Chainlink faces stiff resistance ahead. Over 23,000 addresses bought approximately 74.50 million LINK between $28.50 and $29.40. This crucial supply barrier suggests that bulls will struggle to push prices up.
Therefore, only a daily candlestick close above the $29 supply wall or the triangle’s upper trendline at $31.40 could invalidate the bearish outlook.
