The switch from Central bank gold sales to purchases had a big impact on the gold market. Precious metals investors fail to realize that Central banks sold a staggering amount of gold into the market up until 2009. It’s also quite interesting that Central banks became net purchasers after the 2008 Market meltdown.
There’s been a lot of speculation as to why the Central banks decided to liquidate a portion of their gold holdings, but what we do know is that an amount equaled less than half of the United States' supposed gold reserves was sold into the market from 2002-2009. Furthermore, official gold sales took place right at the very same time the Gold ETF (NYSE:GLD) market took off. From 2002 to 2009, nearly 1,800 metric tons (mt) of gold went into Gold ETFs, which accounted for 52% of Central Bank gold sales during that period.
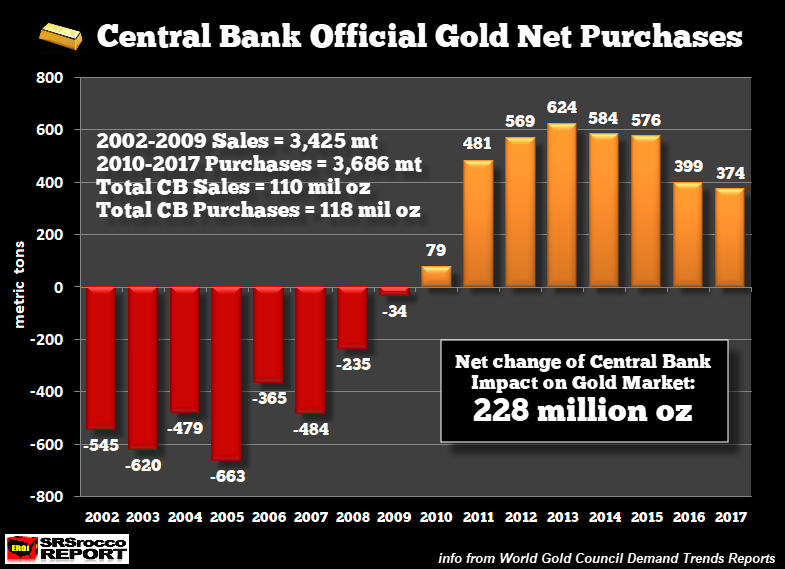
According to the data from the World Gold Council, in just eight years, Central banks sold 3,425 mt of gold, or a massive 110 million oz (Moz) of gold into the market. To get an idea just how much gold this was, from 2002-2008 (the majority of sales), Central Banks supplied roughly 20% of global mine supply. That is one heck of a lot of gold.
To put it another way, 110 Moz is more than the total current 93 Moz of global, transparent gold holdings, including depositories, mutual funds, and ETFs. Moreover, Central banks sold nearly four times the gold that is “supposedly” in the SPDR’s GLD ETF (28 Moz). So, it seems that a lot of the public’s gold went into private hands… LOL.
Regardless, the chart below shows the Central bank net gold purchases from 2002 to 2017:

As we can see, Central bank sales of 110 Moz (2002-2009) switched to purchases of 118 Moz (2010-2017). Thus, the net change on the gold market over this 16-year period was a stunning 228 Moz. We must remember, the market enjoyed an extra supply of 110 Moz from 2002 to 2009, but this became the demand of 118 Moz during the next 8-year period.
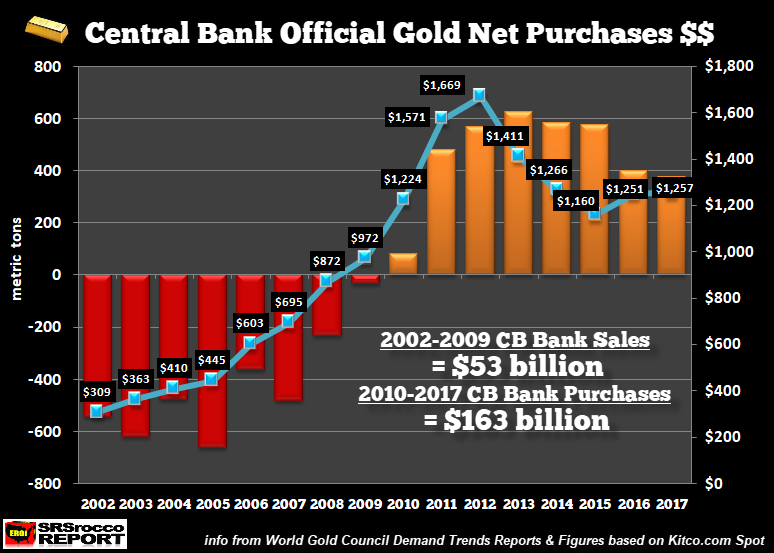
Also, estimated Central bank gold sales were $53 billion versus purchases of $163 billion:

Thus, if the Central banks waited and sold their gold during the second period (2010-2017), they would have made $143 billion rather than the $53 billion (2002-2009). That $143 billion figure is based on selling 110 Moz at an average gold price of $1,300.
Now, of the stated 374 mt of gold purchased by Central Banks in 2017, Smaulgld wrote that Russia accounted for 224 mt, or 60% of the total last year. Also, if you check out Smaulgld’s article linked above, Russia added 804 mt of gold to its reserve from 2014-2017. Which means, Russia purchased 40% of all Central bank gold during that 4-year period.
While the West continues to demonize Russia, they are in much better shape economically if we focus on energy, debt and gold holdings. According to Sputnik News, Russia’s debt to GDP declined to 33%. However, compare Russia’s 33% debt to GDP to Japan (253%), U.S. (110%), France (97%), U.K. (85%), Europen Union (81%) and Germany (64%). Source: TradingEconomics.com
Furthermore, even though the United States is producing a lot more oil, we still have net petroleum imports of 3-4 million barrels per day. Whereas, Russia is exporting over 5 million barrels per day.
Lastly, if we consider that the United States holds 8,133 mt of gold in reserve backed by $21 trillion of debt versus 1,838 mt of official Russian gold reserves supporting $449 billion in debt, Russia comes out as the clear winner. For each ounce of gold that is supposedly held in the U.S. official reserves, there is over $80,000 of debt. Now compare that to $7,600 worth of debt for each ounce of Russian official gold reserves.
It will be quite interesting how the situation unfolds in the global economic and financial systems when the next major market correction takes place.
