Rail, trucking and package delivery are among key indicators of business activity in the United States. The recent relative performance of transportation stocks and the S&P 500 suggests that stocks overall might be somewhat ahead of themselves, or perhaps set up for a correction.
- SPX = S&P 500 (proxies: SPY, IVV and VOO)
- TRAN = DJ Transports (proxies: IYT and XTN [XTN is equal weighted])
- DJUSRR = DJ Railroads (members CSX [CSX], Norfolk Southern [NSC], Union Pacific [UNP])
- DJUDTK = DJ Trucking (member J.B. Hunt [JBHT])
- DJUSAF = DJ Delivery services (members, Fedex [FDX] and UPS [UPS])
These three charts plot the ratio of the price level of each of several transportation indexes versus the S&P 500.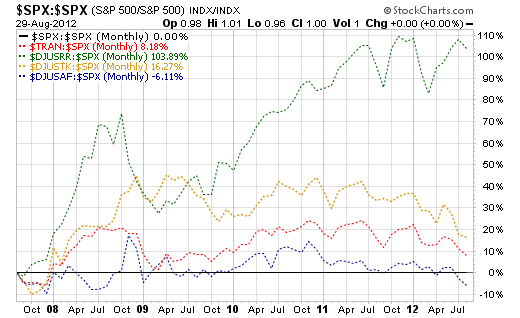
5-Year Monthly Absolute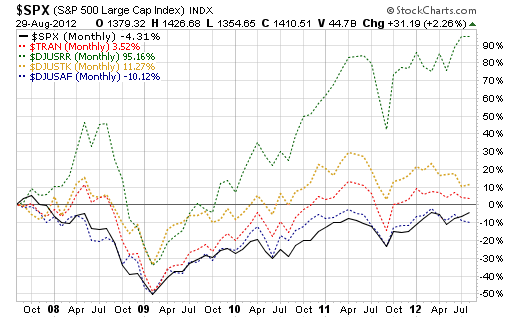
The 5-year chart generally is outperforming the S&P 500 since the market bottom in 2009 until mid-2011, when it was basically flat with the broad index, and then under-performing in 2012.
1 Year Weekly Relative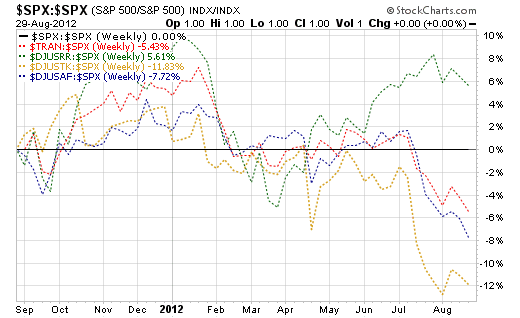
1-Year Weekly Absolute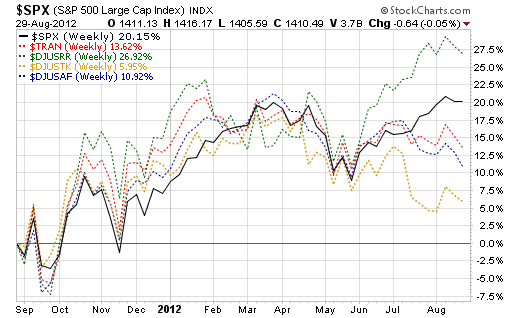
The 1-year chart more clearly shows the turn to negative relative performance in 2012 for all but railroads — and they too have turn down on a relative basis recently.
3 Months Daily Relative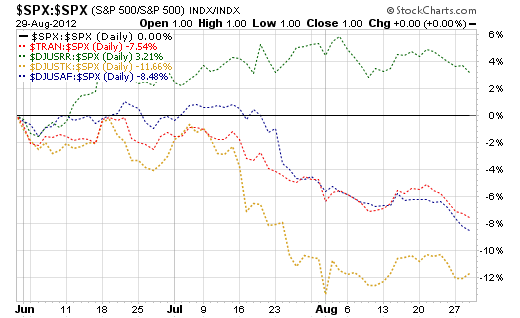
3-Months Daily Absolute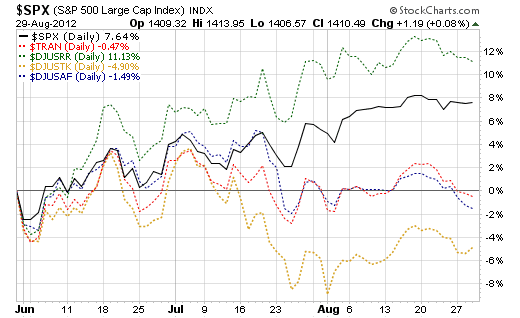
The 3 month chart clearly shows that over the past month, the overall transports and its railroad, trucking and delivery services components are in a down movement. That probably as a lot to do with the flattening of the S&P 500 in the same period.
Disclaimer and Disclosure: This and every post of ours is subject to our general disclaimer. As of the date of this post, we have positions in SPY and NSC.
