"Cash on the Sidelines." You hear this phrase all the time from the media and pundits. How do they know there is cash on the sidelines? Do they have a phone survey that asks a sample of Americans if they have extra cash left to invest? And if they can know, how do they know if it is meaningful and how it will affect anything? It is very difficult to know most times. It is then most likely just a catch phrase used by pundits and the media to reinforce their opinions and further their narratives.
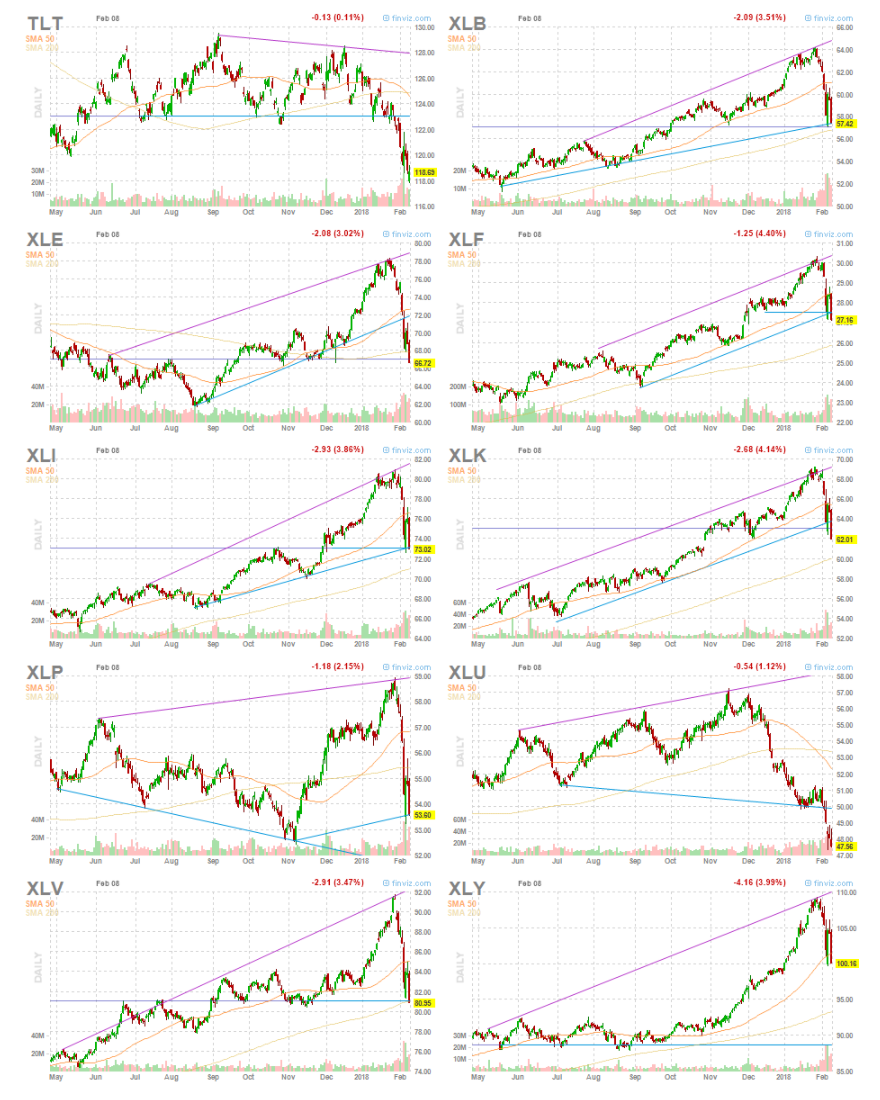
But sometimes there are instances when you can see this in the charts. Take a look at the mess of charts below.

The 10 charts shown cover the nine equity sectors in the stock market plus the US Treasury Bond ETF. Notice anything similar about them? They all had different shapes and slopes leading up to mid-to-late January. Some were strong and some moving lower. But then they all started to move in unison at the start of February. The last week shows all 9 equity market sectors and Treasury Bonds moving to the downside. And all are moving to the downside with increased volume. Put together this is a total market selloff. Money is not moving from one sector to another. It is not moving from stocks to bonds or vice versa. So where is all this money going? To the sidelines.
This is a fine place to ride out a downturn, even if the act of moving to the sidelines has caused that downturn. But it also suggests that when the market has stabilized and starts to move higher there could be significant money pushing either specific sectors or the entire market to the upside as this money rejoins it. It is time to have your shopping list ready.
