The non-seasonally adjusted Case-Shiller home price index (20 cities) for October 2012 (released today) showed the fifth year-over-year gain in housing prices since the end of the housing stimulus in 2010.
- Non-seasonally adjusted home prices were statistically unchanged month-to-month as is normal between September to October.
- Home prices increased year-over-year 4.3% (versus 3.0% in September).
- The market had expected a year-over-year increase between 3.0% and 3.9% (versus the 4.3% reported)
S&P/Case-Shiller Home Price Indices Year-over-Year Change
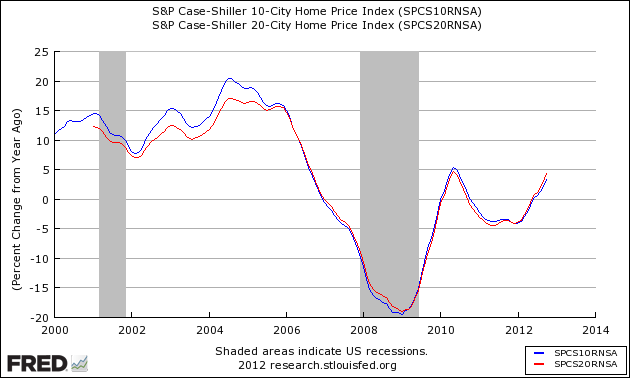
Comparing all the home price indices, it needs to be understood each of the indices uses a unique methodology in compiling their index – and no index is perfect. The National Association of Realtors normally shows exaggerated movements which likely is due to inclusion of more higher value homes.
Comparison of Home Price Indices – Case-Shiller 3 Month Average (blue line, left axis), CoreLogic (green line, left axis) and National Association of Realtors (red line, right axis)
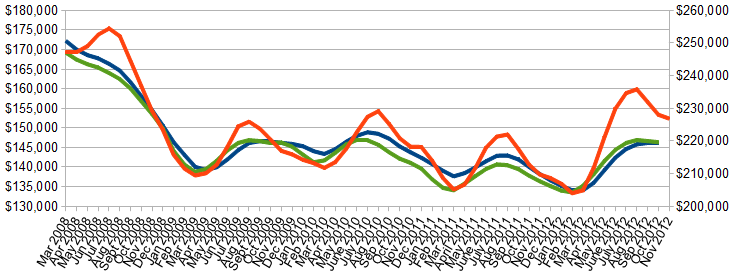
The way to understand the dynamics of home prices is to watch the direction of the rate of change – and not necessarily whether the prices are getting better or worse. Here almost universally – home prices are either improving or becoming less bad – with the National Association of Realtors home prices currently showing the largest price gains.
3rd party Ad. Not an offer or recommendation by Investing.com. See disclosure here or remove ads.
Year-over-Year Price Change Home Price Indices – Case-Shiller 3 Month Average (blue bar), CoreLogic (yellow bar) and National Association of Realtors (red bar)
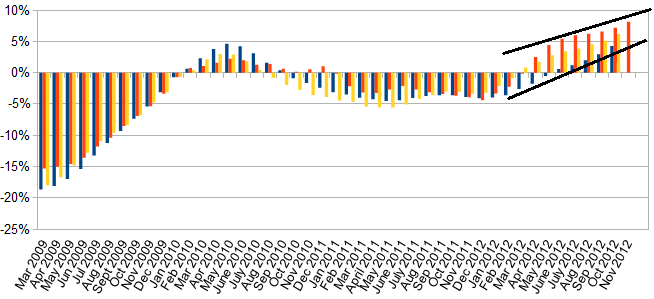
There are some differences between the indices on the rate of “recovery” of home prices. However, the trend for the last 7 to 10 months have been an improving home market
A synopsis of Authors of the Leading Indices:
Case Shiller’s David M. Blitzer, Chairman of the Index Committee at S&P Indices, sees broad gains in the housing market.
"The October monthly numbers were weaker than September as 12 cities saw prices drop compared to seven the month before. The five which turned down in October but not in September, were Atlanta, Dallas, Miami, Minneapolis and Seattle. Among all 20 cities, Chicago was the weakest with prices dropping 1.5%, followed by Boston where prices fell 1.4%. Las Vegas saw the strongest one-month gain with prices up 2.8%.
“Annual rates of change in home prices are a better indicator of the performance of the housing market than the month-over-month changes because home prices tend to be lower in fall and winter than in spring and summer.
Both the 10- and 20-City Composites and 19 of 20 cities recorded higher annual returns in October 2012 than in September. The impact of the seasons can also be seen in the seasonally adjusted data where only three cities declined month-to-month. The 10-City Composite annual rate of +3.4% in October was lower than the 20-City Composite annual figure of +4.3% because the two weaker cities – Chicago and New York – have higher weights in the 10-City Composite.
3rd party Ad. Not an offer or recommendation by Investing.com. See disclosure here or remove ads.
“Looking over this report, and considering other data on housing starts and sales, it is clear that the housing recovery is gathering strength. Higher year-over-year price gains plus strong performances in the southwest and California, regions that suffered during the housing bust, confirm that housing is now contributing to the economy. Last week’s final revision to third quarter GDP growth showed that housing represented 10% of the growth while accounting for less than 3% of GDP.
“One indication of the rebound is the gains from the bottom. The largest rebound is 24.2% in Detroit even though prices there are still about 20% lower than 12 years ago. San Francisco and Phoenix have also rebounded from recent lows by 22.5% and 22.1% with prices comfortably higher than 12 years ago. The smallest recoveries are seen in Boston and New York, two cities in the northeast which suffered smaller losses in the housing bust than the Sunbelt or California.”
CoreLogic suggests home prices will continue to recover (October Data):
“The housing recovery that started earlier in 2012 continues to gain momentum,” said Mark Fleming, chief economist for CoreLogic. “The recovery is geographically broad-based with almost all markets experiencing some appreciation. Sand and energy states continue to experience the most robust appreciation and some judicial foreclosure states are even recording increasing prices.”
“We are seeing an ongoing strengthening of the residential housing market,” said Anand Nallathambi, president and CEO of CoreLogic. “Reduced inventories and improving buyer demand are contributing to stability and growth in home prices which is essential to the long term health of the housing market and the broader economy.”
3rd party Ad. Not an offer or recommendation by Investing.com. See disclosure here or remove ads.
“Excluding distressed sales, home prices nationwide also increased on a year-over-year basis by 5.8 percent in October 2012 compared to October 2011. On a month-over-month basis excluding distressed sales, home prices increased 0.5 percent in October 2012 compared to September 2012, the eighth consecutive month-over-month increase. Distressed sales include short sales and real estate owned (REO) transactions.
The CoreLogic Pending HPI indicates that November 2012 home prices, including distressed sales, are expected to rise by 7.1 percent on a year-over-year basis from November 2011 and fall by 0.3 percent on a month-over-month basis from October 2012 as sales exhibit a seasonal slowdown going into the winter. Excluding distressed sales, November 2012 house prices are poised to rise 7.4 percent year-over-year from November 2011 and by 0.5 percent month-over-month from October 2012. The CoreLogic Pending HPI is a proprietary and exclusive metric that provides the most current indication of trends in home prices. It is based on Multiple Listing Service (MLS) data that measure price changes for the most recent month.”
The National Association of Realtors believes momentum is continuing to build in the housing market (November 2012 data). Lawrence Yun , NAR chief economist, said there is healthy market demand:
“Momentum continues to build in the housing market from growing jobs and a bursting out of household formation,” he said. “With lower rental vacancy rates and rising rents, combined with still historically favorable affordability conditions, more people are buying homes. Areas impacted by Hurricane Sandy show storm-related disruptions but overall activity in the Northeast is up, offset by gains in unaffected areas.”
3rd party Ad. Not an offer or recommendation by Investing.com. See disclosure here or remove ads.
The national median existing-home price for all housing types was $180,600 in November, up 10.1 percent from November 2011. This is the ninth consecutive monthly year-over-year price gain, which last occurred from September 2005 to May 2006.
Distressed homes – foreclosures and short sales sold at deep discounts – accounted for 22 percent of November sales (12 percent were foreclosures and 10 percent were short sales), down from 24 percent in October and 29 percent in November 2011. Foreclosures sold for an average discount of 20 percent below market value in November, whileshort sales were discounted 16 percent.
“The market share of distressed property sales will fall into the teens next year based on a diminishing number of seriously delinquent mortgages,” Yun said.
Lender Processing Services (LPS) October 2012 home price index rose 0.3% month-over-month and 4.3% year-over-year.
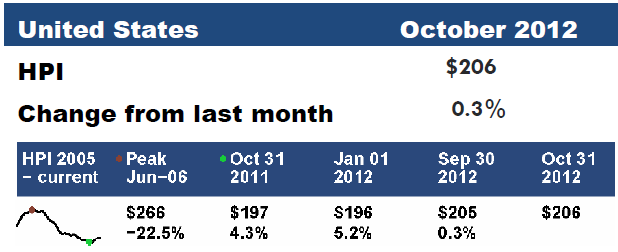
Econintersect publishes knowledgeable views of the housing market.
Caveats on the Use of Home Price Indices
The housing price decline seen since 2005 varies by zip code – and seems to have ended somewhere around the beginning of the 2Q2012. Every area of the country has differing characteristics. Since January 2006, the housing declines in Charlotte and Denver are well less than 10%, while Las Vegas home prices had declined almost 60%.
Each home price index uses a different methodology – and this creates slightly different answers. There is some evidence in various home price indices that home prices are beginning to stabilize – the evidence is also in this post. Please see the post
3rd party Ad. Not an offer or recommendation by Investing.com. See disclosure here or remove ads.
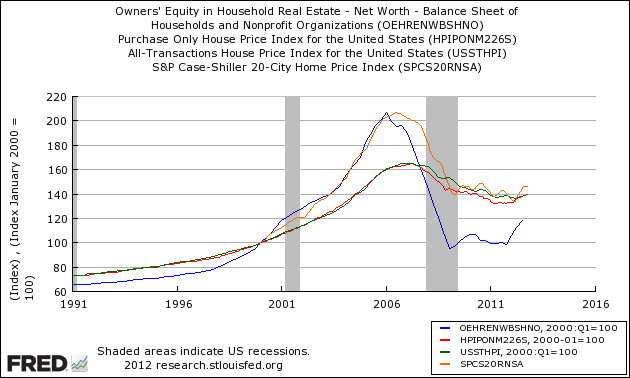
Economic Headwinds from Real Estate Moderate. The most broadly based index is the US Federal Housing Finance Agency’s House Price Index (HPI) – a quarterly broad measure of the movement of single-family house prices. This index is a weighted, repeat-sales index on the same properties in 363 metro centers, compared to the 20 cities Case-Shiller.
The US Federal Housing Finance Agency also has an index (HPIPONM226S) based on 6,000,000 same home sales – a much broader index than Case-Shiller. Also, there is a big difference between home prices and owner’s equity (OEHRENWBSHNO) which has been included on the graph below.
Comparing Various Home Price Indices to Owner’s Equity (blue line)
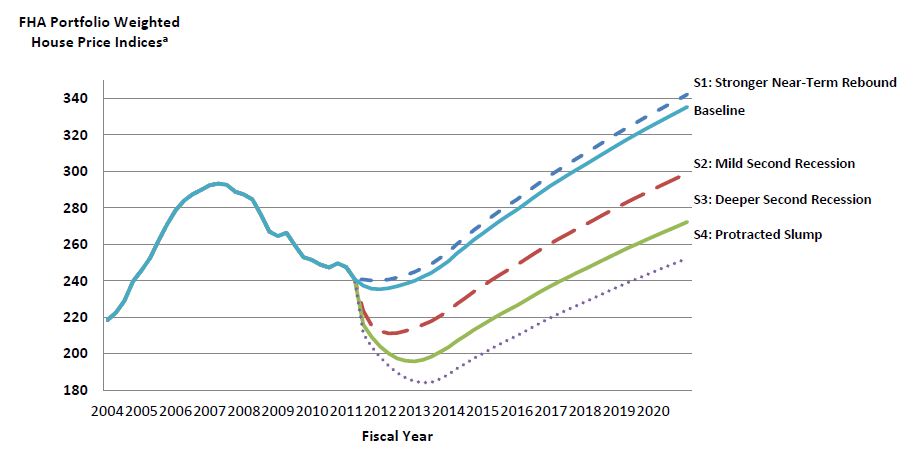
Recent review of the Fed 2011 stress tests for banks has a new recession scenario that would see home prices decline another 20% from here. It is unlikely that the attempts to complete a bottom here could hold under those conditions.
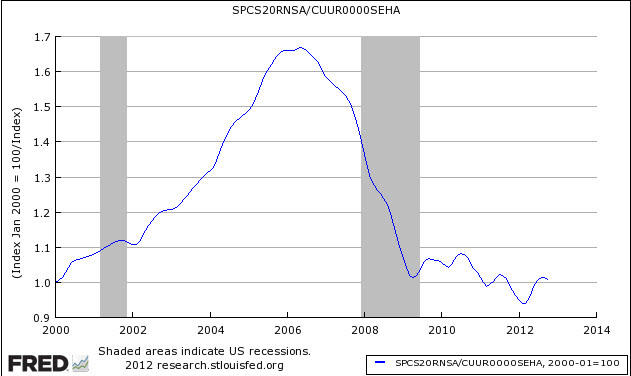
With rents increasing and home prices declining – the affordability factor favoring rental vs owning is reversing. Rising rents are shifting the balance.
Price to Rent Ratio – Indexed on January 2000 – Based on Case-Shiller 20 cities index ratio to CPI Rent Index
Which stock should you buy in your very next trade?
With valuations skyrocketing in 2024, many investors are uneasy putting more money into stocks. Unsure where to invest next? Get access to our proven portfolios and discover high-potential opportunities.
In 2024 alone, ProPicks AI identified 2 stocks that surged over 150%, 4 additional stocks that leaped over 30%, and 3 more that climbed over 25%. That's an impressive track record.
With portfolios tailored for Dow stocks, S&P stocks, Tech stocks, and Mid Cap stocks, you can explore various wealth-building strategies.
