Forex News and Events:
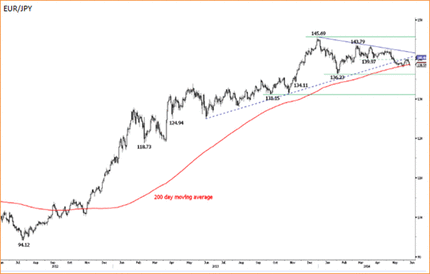
The international capital movements continue to be driven by carry trade opportunities. The Brazilian real remains in spotlight given BCB’s decision to extend its BRL-supportive program to taper FX volatilities. In Turkey, the political pressures on further rate cut keep the lira demand at timid levels. On the funding currencies side, EUR grinds steadily lower while JPY-bears are subject to event risk (June 12-13th BoJ meeting). EUR/JPY finally broke its 200-dma support yet trades range-bound given the risk of a rebound in JPY-appetite by the end of the week.
Brazil attractiveness for carry trades
Given the rising appetite in carry pairs, BRL/JPY steps in the short-term bullish zone; MACD (12, 26) turns positive suggesting further gains in the short-run. The BRL longs gained significant momentum after the Brazil Central Bank announced the extension of its Real-supportive program, previously set to expire by the end of June. BCB sold USD 198.8mn worth of FX swaps and rolled over USD 494.3mn contracts to taper volatility in BRL. The 1-month implied vol on USD/BRL stepped down to one year lows (currently at 8.44%). In addition, we remind that Brazil raised its policy rate from 7.5% to 11.0% through nine consecutive rate actions (since April 2013) to control inflation and to anticipate Fed’s QE exit. The BCB’s rate policy and FX interventions should continue backing capital inflows into Real – especially from carry trade perspective.
Over the past two months, the steady BRL-negative pressures kept USD/BRL in a neutral/positive band between 2.1800/2.3000. The recent developments on monetary policy leg triggered aggressive BRL demand over the past week, erasing World Cup related tensions (strike, protests etc.). USD/BRL trades close to two week lows and should continue testing the May resistance zone (2.2280/2.2300) on the downside. Trend and momentum indicators suggest a short-term bearish reversal pattern in USD/BRL, option bets are negatively skewed below 2.2500. Versus the euro, the negative rates in the Euro-zone and EUR debasement sent EUR/BRL aggressively below its 21-dma (3.0468). Support is seen sub-3.000, stops are eyed below.
Turkish lira carries rate cut risk
While the Brazilian real has become attractive for carry traders, Turkish lira remains under pressure due to rate cut speculations. Released yesterday, the faster-than-expected GDP growth in Q1 revived enthusiasm on Turkish recovery. In his speech today, Turkey’s Isik stated that the country will easily meet 4% year-end target, that the real rates should be nearing zero percent while adding that the lira appreciation should be curbed to protect exports. At this stage, we believe that the lira appreciation may be controlled by side tools (direct FX interventions, ROMs), yet a second month of consecutive rate cut will only raise fears on country’s ability to manage a potential reversal in international capital flows.
JPY-crosses mixed pre-BoJ
EUR/JPY broke its 200-dma (138.72) on the downside given the broad based selling pressures on EUR. Consolidation below the 200-dma should intensify the downside pressures towards 137.98 (May low), then 136.23 (2014 low). Large option barriers trail below 139.00 for today expiry.
Walking into June 12-13th BoJ meeting, traders are likely to turn neutral on JPY-crosses given the risk of a short-term increase in JPY-demand following a status quo announcement (consensus). As mentioned previously, the current capital flows are mostly driven by interest rate differentials and central banks’ policy outlooks. Given the aggressive monetary stimulus in the Euro-zone and liquidity expansionist measures in China, we doubt a pullback in JPY crosses due to BoJ inaction. We will be also seeking reaction from Japan to ECB and PBoC actions. Given the improvement in domestic macro fundamentals, BoJ has no apparent reason to act in June meeting. In fact, Japan released 6.7% growth in GDP (q/q annualized) in the first quarter with significant expansion of 7.6% in business spending (vs. 4.6% exp. & 4.9% last). The domestic corporate good prices advanced 0.3% m/m in May (vs. 0.1% exp. & 2.8% after April’s tax hikes), bringing CGPI to 4.4% y/y (vs. 4.1% expected and last). The sales tax hike has seemingly not hit the corporate price dynamics back to pre-hike levels. The inflation dynamics remain in line with BoJ’s 2.0% target.

Today's Key Issues (time in GMT):
2014-06-11T11:00:00 USD Jun 6th MBA Mortgage Applications, last -3.10%2014-06-11T18:00:00 USD May Monthly Budget Statement, exp -$131.0B
2014-06-11T21:00:00 NZD RBNZ Official Cash Rate, exp 3.25%, last 3.00%
The Risk Today:
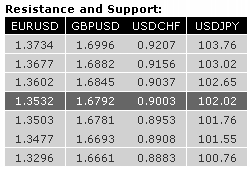
EUR/USD's bullish intraday reversal on 5 June has created a key support at 1.3503. Monitor that level as buying interest has thus far remained weak. Hourly resistances can now be found at 1.3602 (10/06/2014 high) and 1.3677. In the longer term, the break of the long-term rising wedge (see also the support at 1.3673) indicates a clear deterioration of the technical structure. The long-term downside risk implied by the double-top formation is 1.3379. Key supports can be found at 1.3477 (03/02/2014 low) and 1.3296 (07/11/2013 low).
GBP/USD has thus far failed to break out of its declining channel. The break of the support at 1.6781 (06/06/2014 low) indicates persistent selling pressures. A key support lies at 1.6693. An initial resistance can be found at 1.6784 (09/06/2014 low). Another resistance stands at 1.6845. In the longer term, despite the break of the long-term rising channel, the lack of significant bearish reversal pattern suggests a limited downside risk. As a result, a medium-term bullish bias remains favoured as long as the support at 1.6661 (15/04/2014 low) holds. A major resistance stands at 1.7043 (05/08/2009 high).
USD/JPY has weakened and is now close to the low of its rising channel. Monitor the hourly support at 102.12 (06/06/2014 low). Another support lies at 101.76 (02/06/2014 low). Hourly resistances stand at 102.65 (09/06/2014 high) and 103.02. A long-term bullish bias is favoured as long as the key support 99.57 (19/11/2013 low) holds. Monitor the support area provided by the 200 day moving average (around 101.55) and 100.76 (04/02/2014 low). A major resistance stands at 110.66 (15/08/2008 high).
USD/CHF has thus far successfully tested the support implied by the 38.2% retracement (0.8910) of its recent rise and has finally been able to make a daily close above the 200 day moving average. However, the sharp bearish reversal on 5 June is likely to weigh on the short-term upside potential. Indeed, a significant resistance now stands at 0.9037. An initial support lies at 0.8965 (10/06/2014 low). From a longer term perspective, the bullish breakout of the key resistance at 0.8953 suggests the end of the large corrective phase that started in July 2012. The long-term upside potential implied by the double-bottom formation is 0.9207. A key resistance stands at 0.9156 (21/01/2014 high).

