Canadian dollar bulls had another week to forget, after the USD/CAD rate surged from a low of 1.2615 on Monday to nearly 1.2900 so far. There have been two fundamental factors that applied pressure on the Loonie – the decline in crude oil prices and Donald Trump’s intention to impose import tariffs of 10% on aluminum and 25% on steel. Canada is the largest steel exporter to the United States and the country’s Trade Minister already expressed concerns about the proposed tariffs, calling them “unacceptable“.
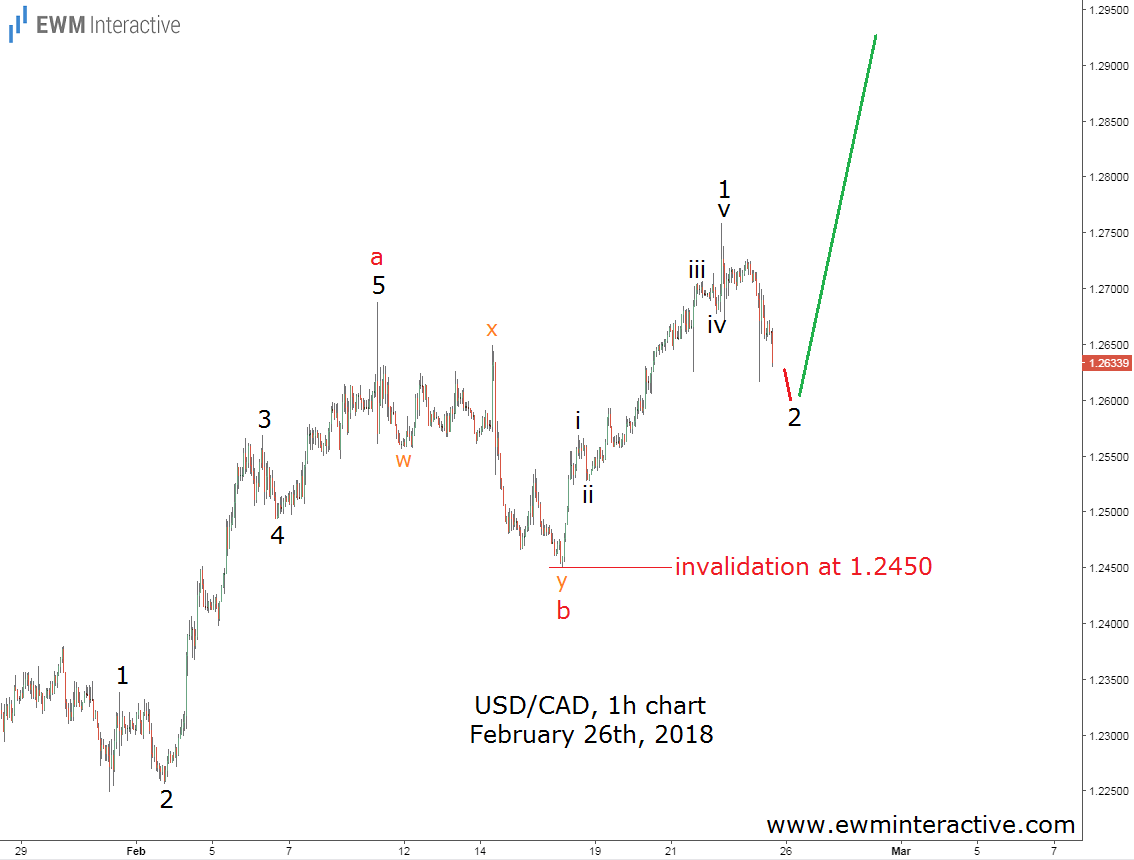
Unfortunately, both factors could only explain the Canadian dollar’s plunge after the fact, but could not prepare us for it in advance. The Elliott Wave Principle, on the other hand, managed to put traders ahead of the news. The chart below was sent to subscribers before the market opened on Monday, February 26.

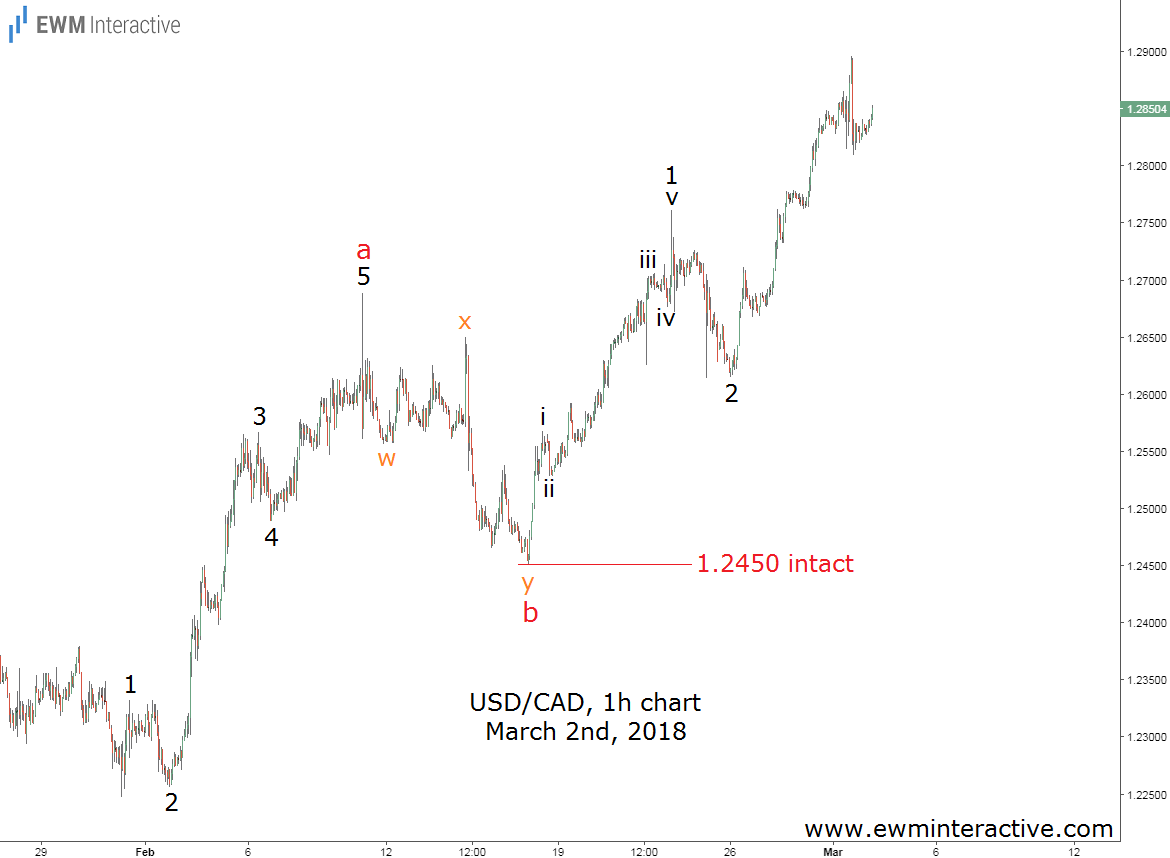
As visible, we thought USD/CAD should continue to the north in wave 3 of “c”. Of course, we did not come up with this chart out of nowhere. The analysis also included the pair’s weekly, daily and 4-hour charts, which led the positive outlook on the 1-hour chart. This time-frame also allowed us to identify a stop-loss level at 1.2450. This figure was appropriate, because of the impulsive structure of the rally from 1.2450 to 1.2761, which suggested that as long as the starting point of the impulse was intact, the bulls were still in charge. The updated chart below visualizes the suffering the Canadian dollar had been through during the last five trading days.

1.2615 was the best USD/CAD bears managed to achieve before making way for the bulls to lift the pair to as high as 1.2896 by Thursday, March 1st. The healthy distance between Monday’s low and the invalidation level at 1.2450 kept the positive outlook alive. All traders had to do was take advantage of it, with or without Trump’s tariffs.
