Thursday’s divergence between European and US data has caused a strong push back inside major bullish channels for the European currencies and as such the dollar has dropped sharply, dragging the Yen up as it goes. Poor data from China has soured sentiment for the Antipodean currencies and Aussie has now begun another fall in what seems like a never ending bear trend for the Australian dollar.
The pound having pushed so strongly higher recently to the downfall of the EUR/GBP has finally run out of legs and is starting to look tired now that the GBP% index has reached the top of it’s bullish channel, which has made the dramatic push higher for the euro reverse trend for the EUR/GBP, further supporting the euro and slowing the pound.
Tellingly, the market clearly doesn’t believe that the modest amount of taper is worth considering as a catalyst for major dollar strength, although perhaps without it, we could be in a strong bear trend for the dollar rather than quite volatile sideways consolidation.
USD% Index
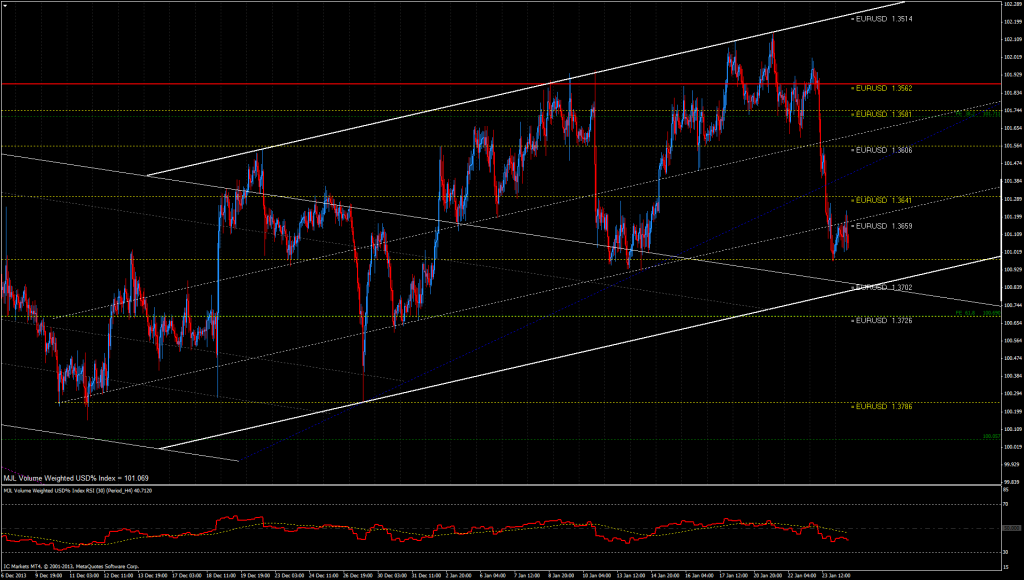
The strong rejection of highs on Thursday has suggested a lack of momentum to the upside and allowed for the bears to push the dollar back to within the recent moderate range. Although the current bullish channel shown has not been broken, the fervour to jump onto European and UK strength may keep the dollar at bay once again should we rally higher towards the top of the range once more and could even break though support to the wider sideways consolidation range.. I am bearish USD
USD% Index Resistance (EUR/USD support): EUR/USD 1.3659, 1.3641, 1.3600
USD% Index Support (EUR/USD support): EUR/USD 1.3700, 1.3726, 1.3786
EUR% Index
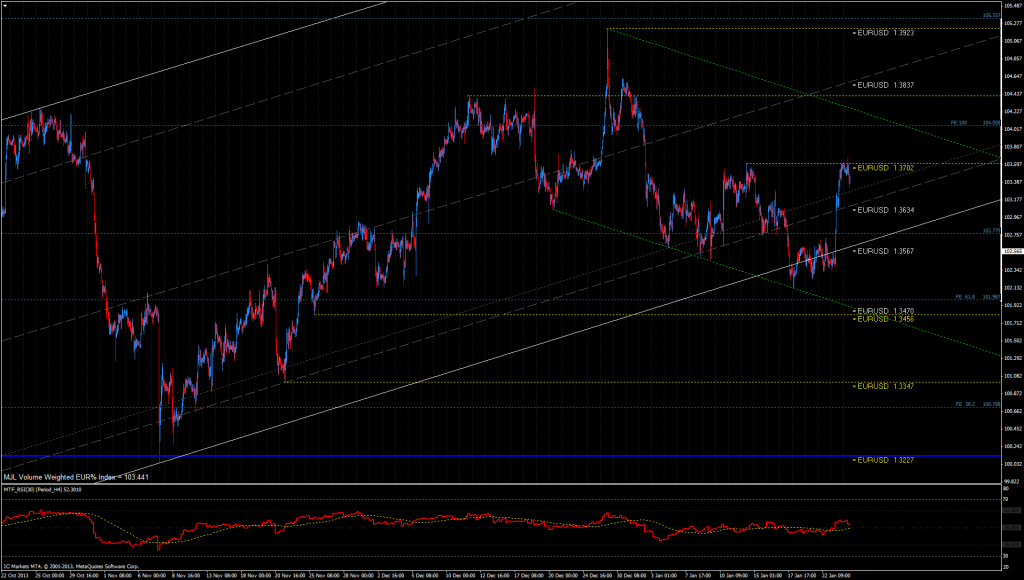
The lack of ability to cleanly break the major bullish channel support has combined with the much better than expected European manufacturing data to allow for a strong push comfortably back inside the bullish channel. The high from last week was used as a take profit point although this will likely be only a minor retracement for trend continuation given the now very bullish market sentiment. It feels as though traders have finally thrown in the towel for major dollar strength as a result of taper for the time being. I am bullish EUR
EUR% Index Resistance: EUR/USD 1.3700, 1.3750
EUR% Index Support: EUR/USD 1.3634, 1.3567
JPY% Index
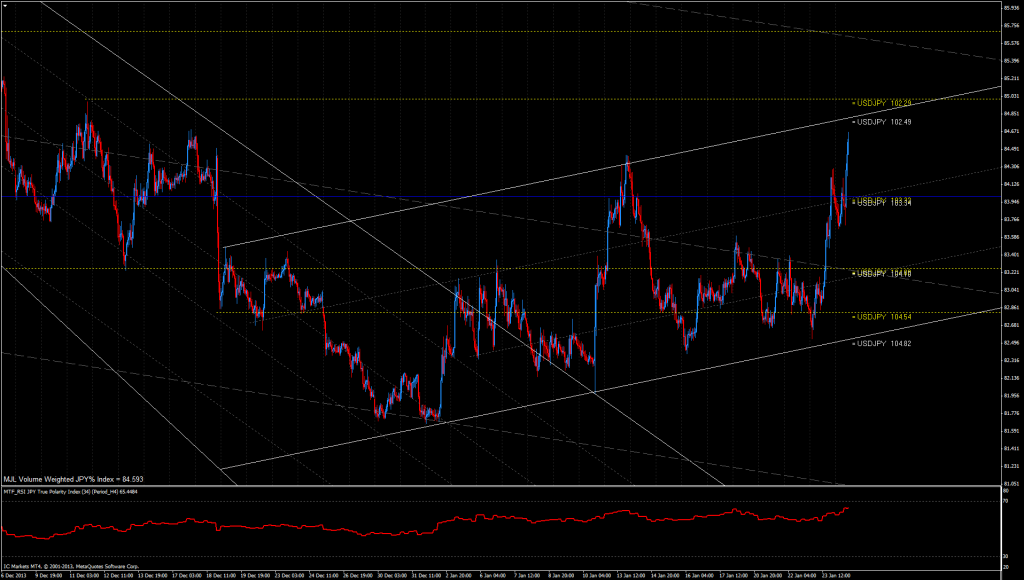
Very close to testing the top of the recent bullish channel, it will be very telling how US dollar weakness will effect the Yen, with the possibility of a further drop in the dollar, Yen bears may want to take profit before a stronger correction higher then re-enter at a better price. There will no doubt be some reaction to the strong resistance though given the momentum to the downside from such a long bearish trend. As such if there is a good reaction from resistance then we could see this being the resistance level of a longer term bearish flag and as such another medium term top. I am bearish while so close to the top of the bullish channel
JPY% Index Resistance (USD/JPY Support): USD/JPY 102.50, 102.29
JPY% Index Support (USD/JPY Resistance): USD/JPY 103.00, 103.34, 104.00
GBP% Index
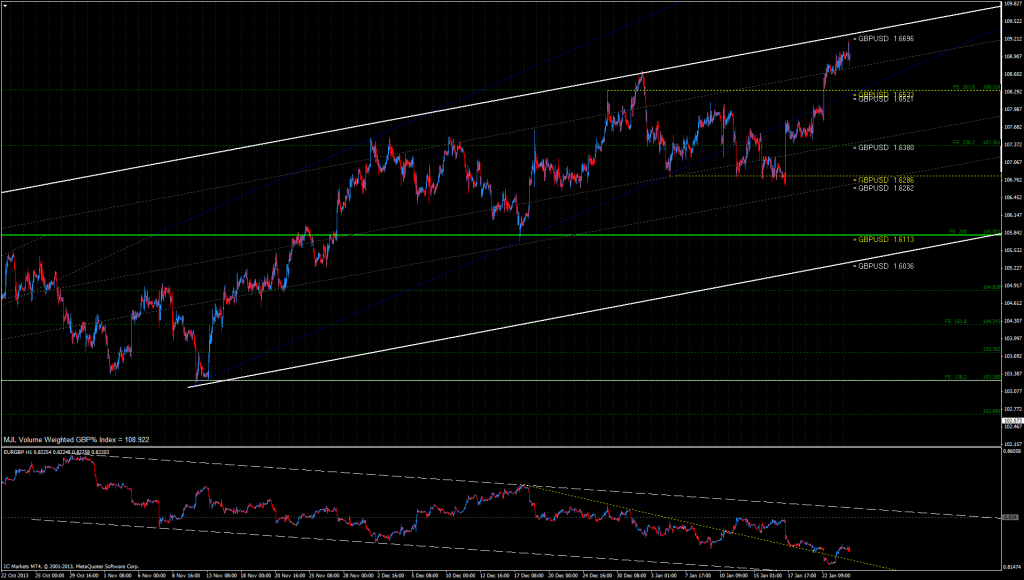
Having enjoyed such a bullish start to the year, the GBP% index has now met the upper bounds of the wide bullish channel and as such some profit taking may now occur, particularly if EURGBP buying takes hold and we see a further rally in the cross. Longer term though, fundamental momentum is still very impressive which will mean that any dips will be bought for the time being.I am neutral GBP while so overbought and below major channel resistance
GBP% Index Resistance: GBP/USD 1.6696, 1.6700
GBP% Index Support: GBP/USD 1.6600, 1.6533, 1.6521
AUD% Index
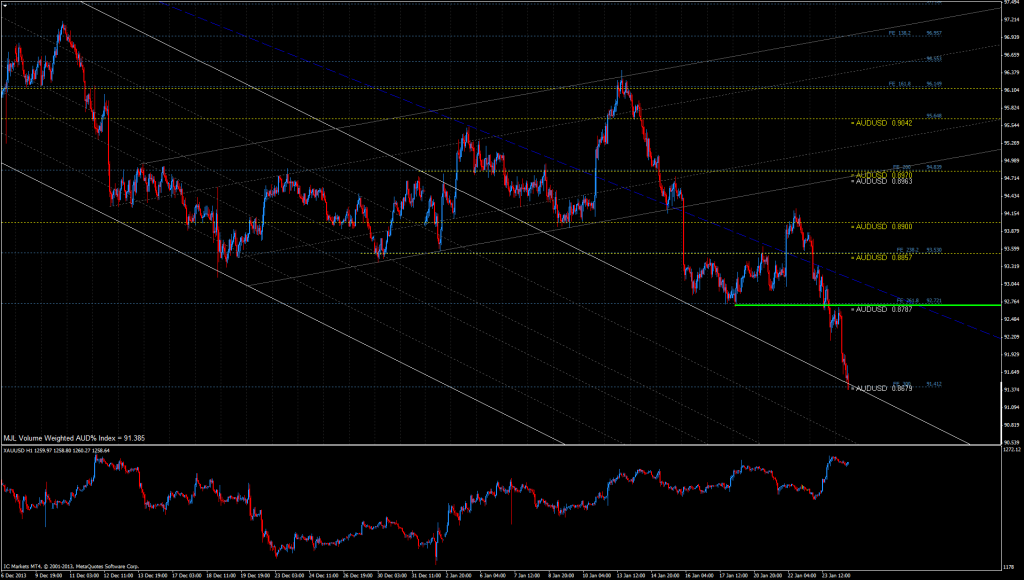
Sentiment for the Australian dollar remains very weak even with the better than expected CPI print this week. It was trumped by the poor Chinese data with the Asian superpower still the main driving force for the Australian mining sector that plays such a large part in the Australian economy. Still considered overvalued by the RBA it seems Stevens will get his wish of 0.8500 soon enough if this momentum to the downside continues. Currently at support that may be it for the week but any pops higher from profit taking or weekly opening gaps will likely find offers. I am bearish AUD
AUD% Index Resistance: AUD/USD 0.8787, 0.8800
AUD% Index Support: AUD/USD 0.8679, 0.8600
CHF% Index
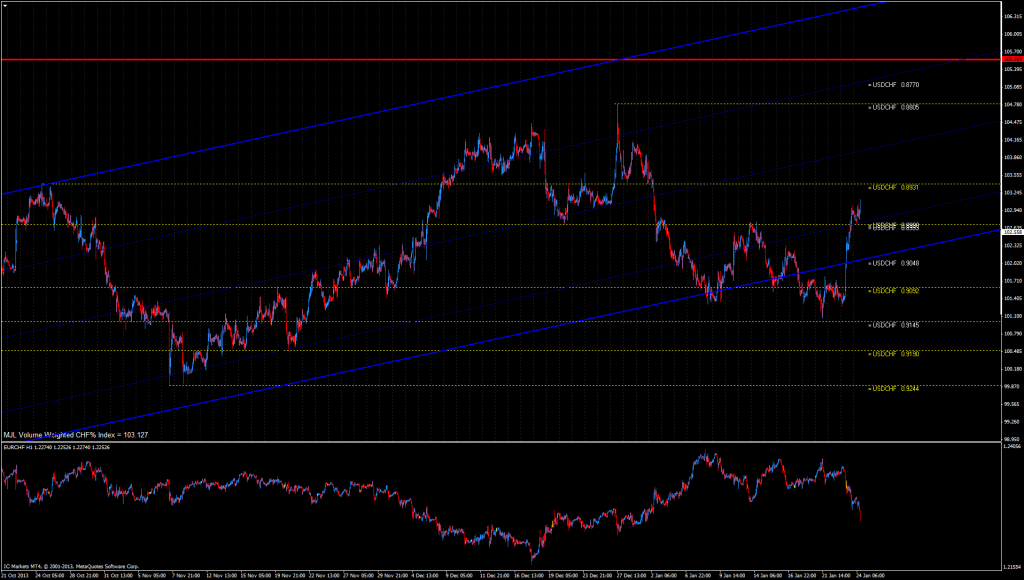
Strong EUR/CHF selling and USD/CHF buying has caused the CHF index to rocket back higher inside the recently broken bullish channel. This will remain likely to continue as the Swiss Franc continues to display the price action of a more volatile euro. As such USD/CHF shorts should outperform EUR/USD longs. I am bullish CHF
CHF% Index Resistance (USD/CHF support): USD/CHF 0.8931, 0.8900
CHF% Index Support (USD/CHF resistance): USD/CHF 0.9000, 0.9050

