When it comes to employment statistics, it is pretty easy to prove any opinion. The Bureau of Labor Statistics (BLS) obliges our need for data by using two very different methodologies for compiling the monthly employment situation - the household survey vs. the establishment survey.
Follow up:
Data based on household interviews are obtained from the Current Population Survey (CPS), a sample survey of the population 16 years of age and over. The survey is conducted each month by the Bureau of the Census for the Bureau of Labor Statistics and provides comprehensive data on the labor force, the employed, and the unemployed, classified by such characteristics as age, sex, race, family relationship, marital status, occupation, and industry attachment. The survey also provides data on the characteristics and past work experience of those not in the labor force. The information is collected by trained interviewers from a sample of about 50,000 households located in 792 sample areas. These areas are chosen to represent all counties and independent cities in the U.S., with coverage in 50 States and the District of Columbia. The data collected are based on the activity or status reported for the calendar week including the 12th of the month.
Data based on establishment records are complied each month from mail questionnaires and telephone interviews by the Bureau of Labor Statistics, in cooperation with State agencies. The Current Employment Statistics (CES) survey is designed to provide industry information on nonfarm wage and salary employment, average weekly hours, average hourly earnings, and average weekly earnings for the Nation, States, and metropolitan areas. The employment, hours, and earnings data are based on payroll reports from a sample of over 390,000 establishments employing over 47 million nonfarm wage and salary workers, full or part time, who receive pay during the payroll period which includes the 12th of the month. The household and establishment data complement one another, each providing significant types of information that the other cannot suitably supply. Population characteristics, for example, are obtained only from the household survey, whereas detailed industrial classifications are much more reliably derived from establishment reports.
Monthly, we are faced with an employment report that provides different answers to marginally different questions - "What is the current employment situation?" Not to blow this out of proportion - the general trends for these two methodologies are similar, but differ in magnitude. I am NOT a fan of surveys (especially ones that try to model the population of the USA) as they rely on the perceptions of the surveyor, and the honesty and understanding of the surveyee. Having said this, there are portions of the household survey which are not duplicated in the establishment survey - such as unemployment stats or Part Time employment.
There has been much discussion of Part Time employment recently - as many right wing pundits are claiming Obamacare is responsible for a perceived increase. Doug Short penned an analysis concluding:
With regard to Obamacare and part-time employment, as I've repeatedly emphasized: The surge in part-time employment was triggered by the recession, not by the Affordable Care Act, as the next chart clearly illustrates.
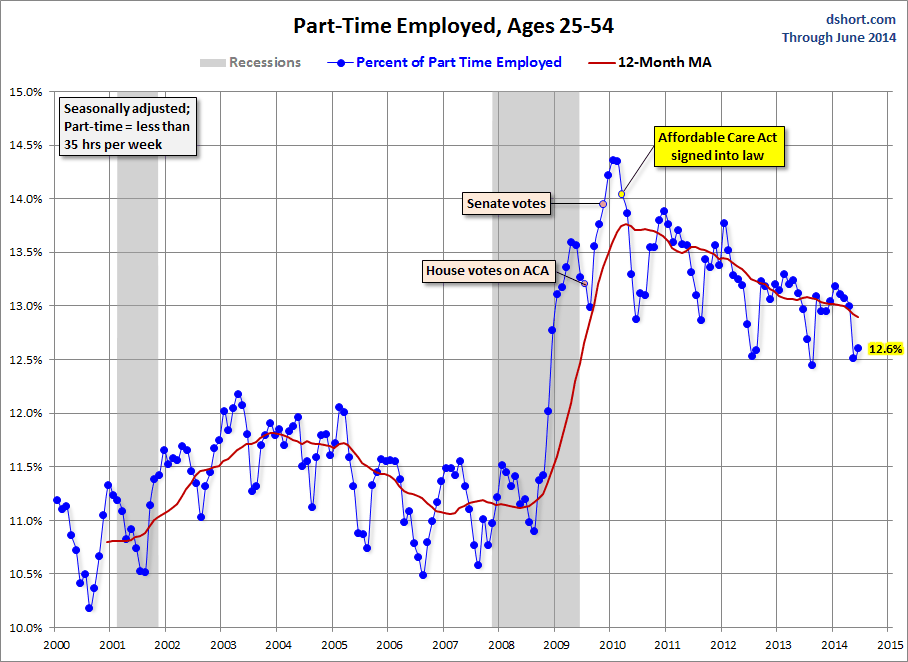
What follows is a similar chart - for all age groups - and for people who want to work full time but cannot find full time employment. This chart too suggests that Obamacare is not noticeably elevating Part Time employment. However, there is no way to prove that the number of people employed part time would not have declined faster had Obamacare not been implemented. That would be a difficult case to make, in my opinion.
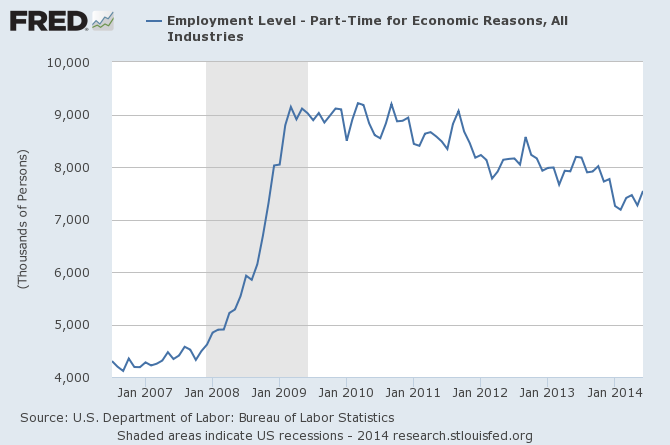
A little side note on the the household survey - note that full time employment has not reached the pre-recession peak.
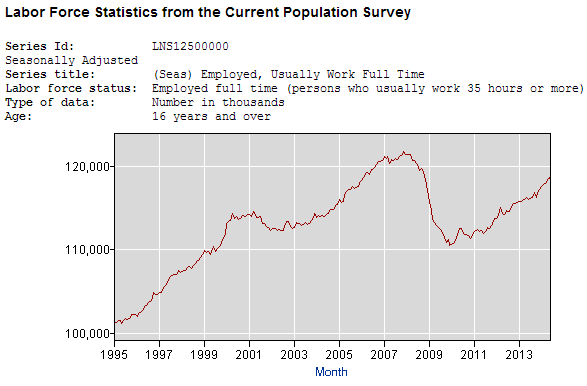
And note further that the household survey also does not show the total employment in the USA has reached the pre-recession peak.

It seems that the rise in Part Time employment is a New Normal phenomenon probably unrelated to Obamacare but more likely related to other causes.
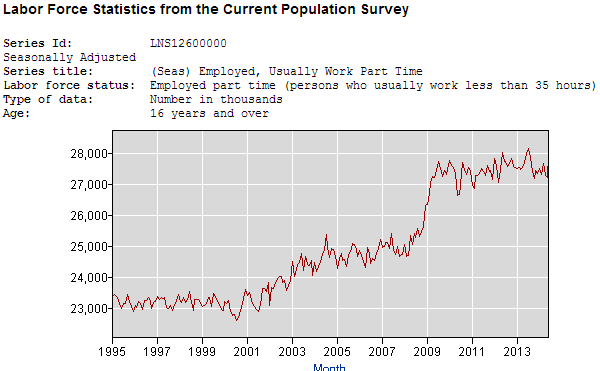
I am not a fan of Obamacare - an abomination which has as many bad elements as good elements. But there is no data to suggest it is creating noticeable Part Time job gains at the expense of Full Time jobs.
Other Economic News this Week:
The Econintersect Economic Index for July 2014 is showing continued growth acceleration. Outside of our economic forecast - we are worried about the consumers' ability to expand consumption because the ratio between income and expenditures continues near all time highs. The GDP contraction for 1Q2014 is a paper contraction as GDP is determined by playing games with accounts. For 2Q2014 GDP, the trade balance will be a serious headwind.
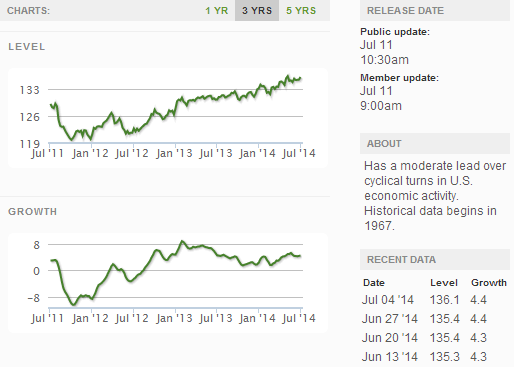
The ECRI WLI growth index value has been weakly in positive territory for many months - but now in a noticeable improvement trend. The index is indicating the economy six month from today will be slightly better than it is today.
Current ECRI WLI Growth Index
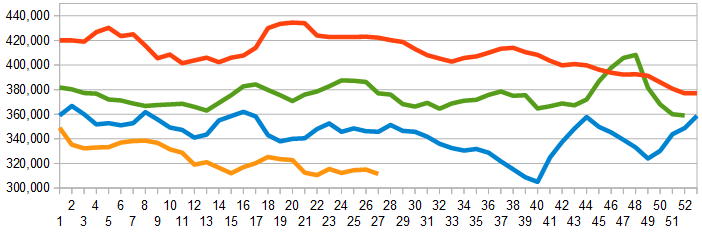
The market was expecting the weekly initial unemployment claims at 305,000 to 321,000 (consensus 315,000) vs the 304,000 reported. The more important (because of the volatility in the weekly reported claims and seasonality errors in adjusting the data) 4 week moving average moved from 315,000 (reported last week as 315,000) to 311,500
Weekly Initial Unemployment Claims - 4 Week Average - Seasonally Adjusted - 2011 (red line), 2012 (green line), 2013 (blue line), 2014 (orange line)
Bankruptcies this Week: USEC
Weekly Economic Release Scorecard:
Click here to view the scorecard table below with active hyperlinks


