The series of higher oil prices appears to be over as today, we might see the bulls' power tested. Where can the bears aim realistically and what is most likely to happen next? These are certainly valid questions as the oil price has reached an important resistance and appears hesitating today. Will some geopolitical news come to the rescue? High time to dive in...
Let's take a closer look at the charts below (charts courtesy of http://stockcharts.com and www.stooq.com ).

We wrote these words yesterday:
(...) Let's check current pricing now. Crude oil appears set for a strong opening, as it changes hands at around $59.30 currently. Therefore, an upswing continuation targeting the late-May intraday peak (or even the blue declining resistance line) can't be ruled out prior to any serious attempt to move lower.
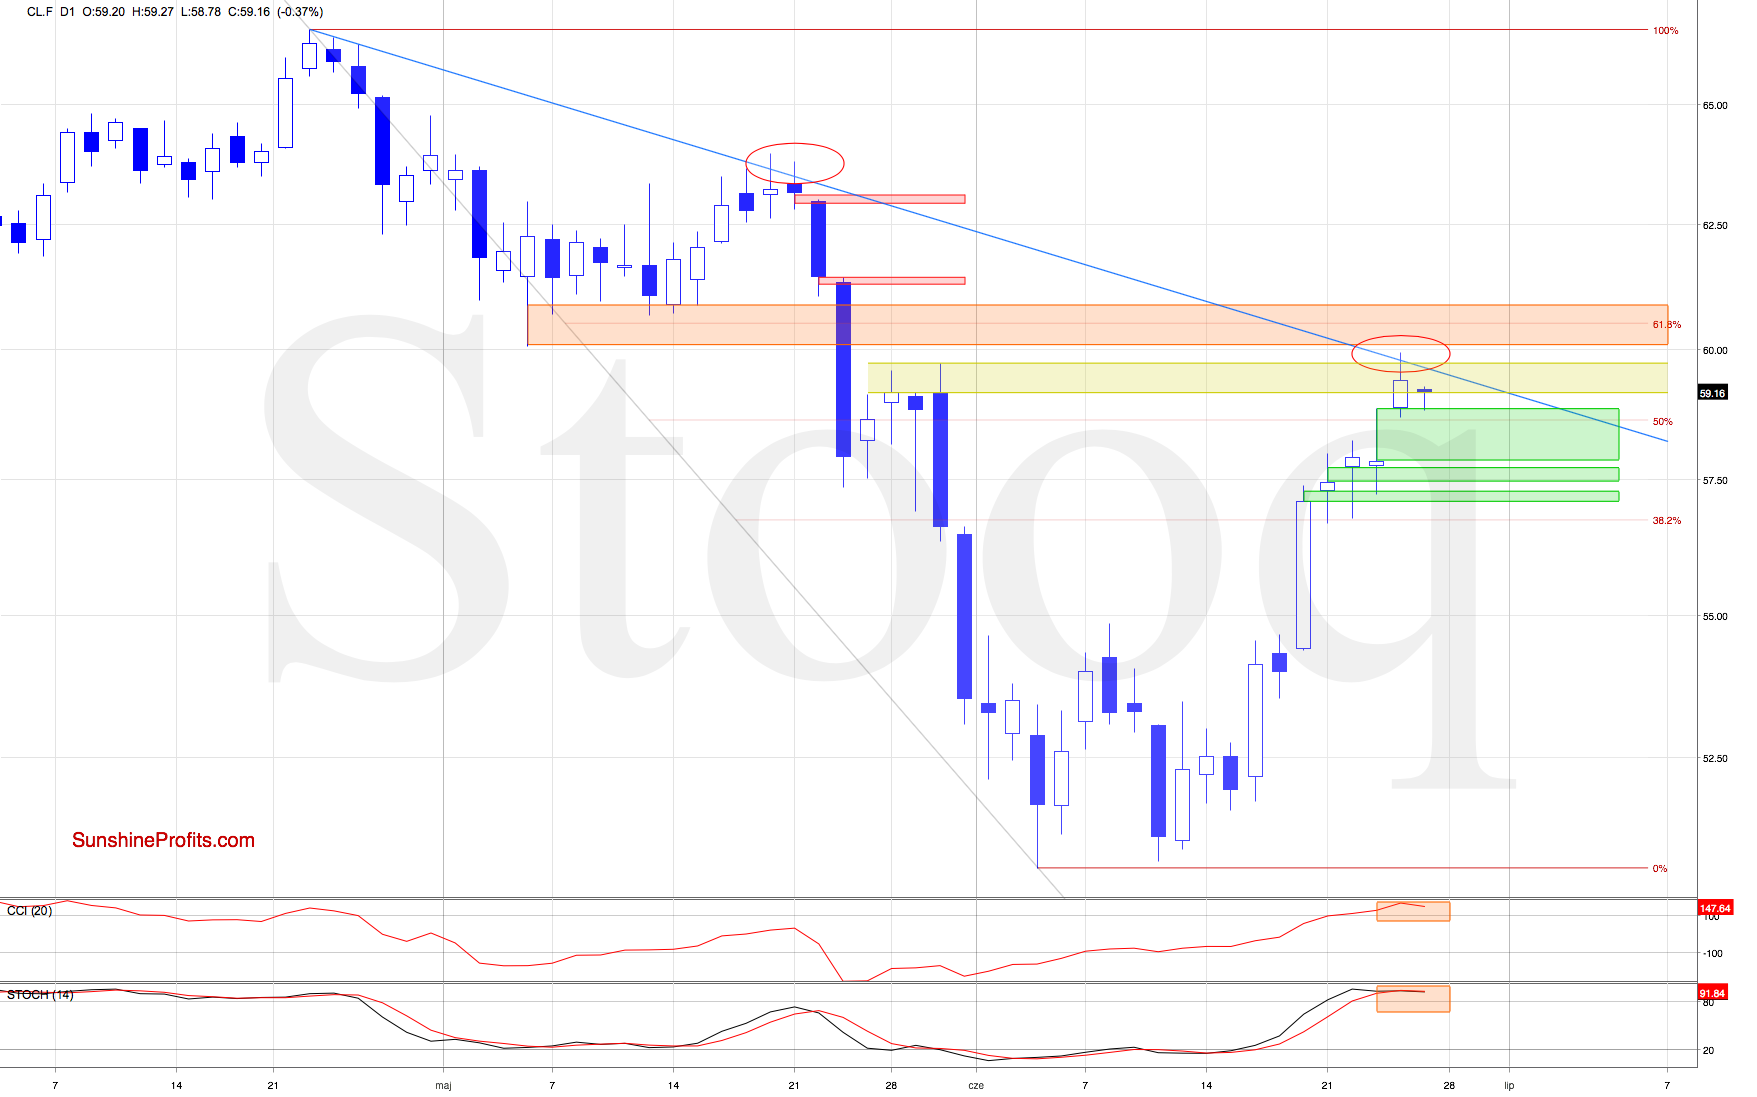
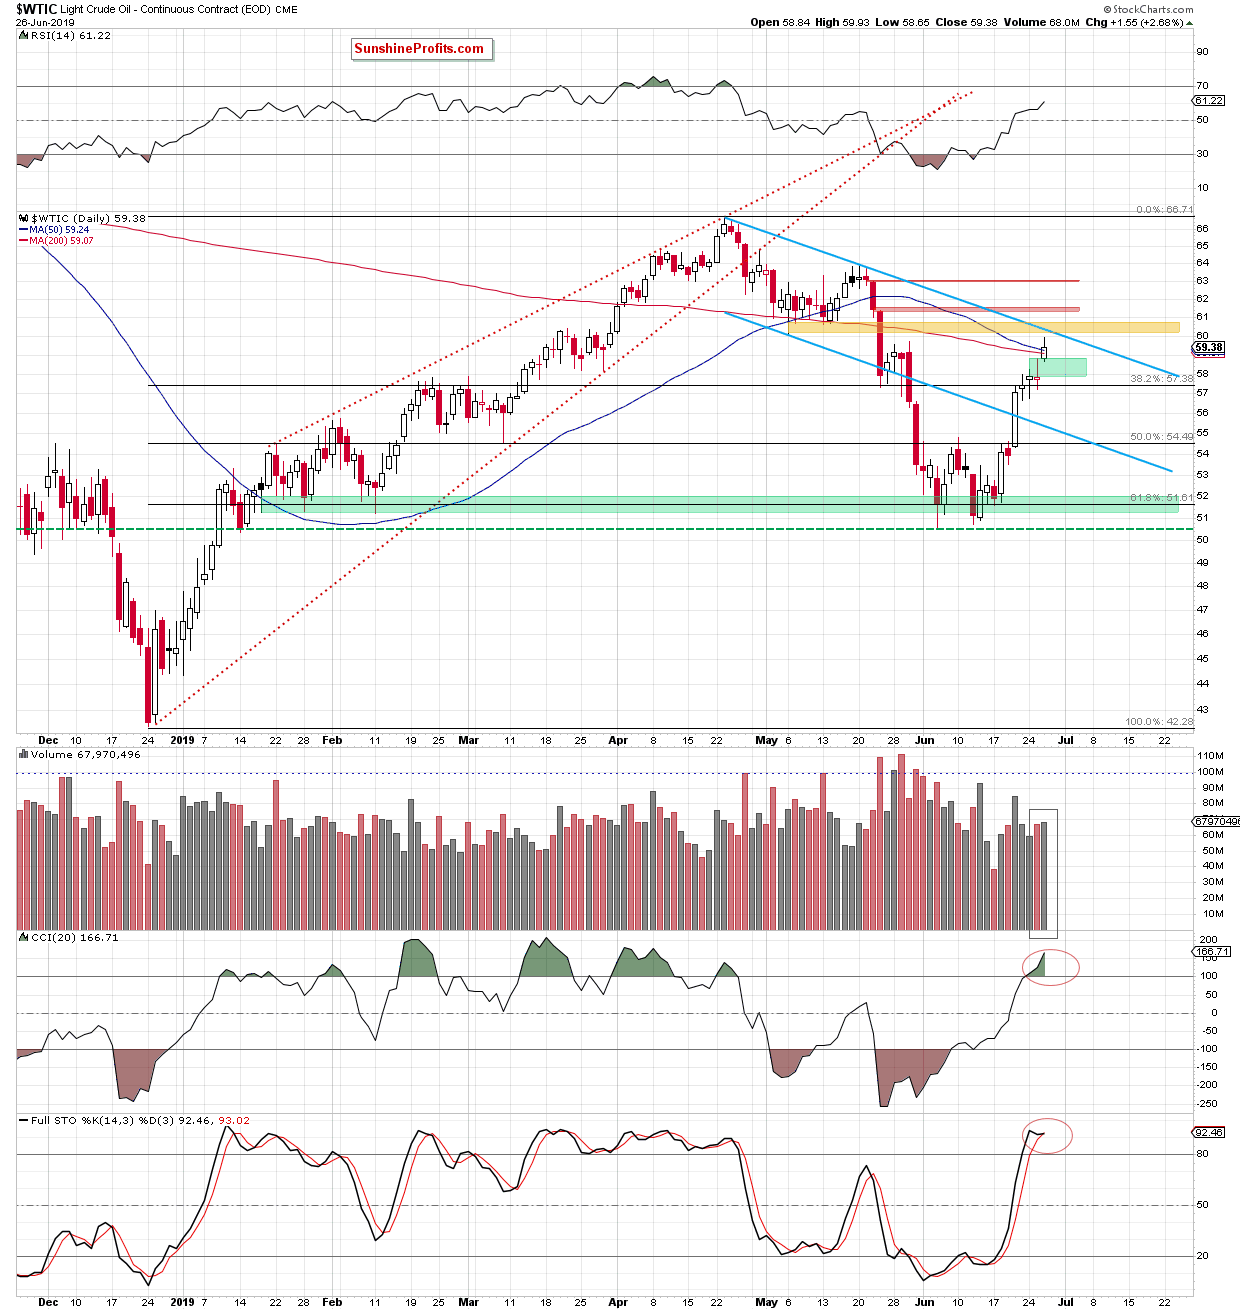
Crude oil went on to test not only the late-May peak, but also the declining blue resistance line. Nevertheless, there was no daily close above the blue line. Instead, the bulls gave up half of their gains, and oil closed well below this resistance.
We have already seen a similar price action on May 20 and also the following day. Back then, such moves preceded a sizable downswing, which increases the likelihood of at least a brief reversal from current levels.
The bearish outlook is also reinforced by the current position of the daily indicators and bearish divergence between the crude oil price and the Stochastic Oscillator.

Additionally, yesterday's upswing materialized on smaller volume than what we saw a day earlier during the small pullback. It raises some doubts about the bulls' strength.
Please note that the recent upward move took crude oil futures (as seen on the first chart) to the orange resistance area created by the early- and mid-May lows (marked with yellow on the second chart). This area is also reinforced by the 61.8% Fibonacci retracement.
What does it mean going forward? Even if the bulls manage to push the oil price higher, the space for gains looks limited.
On the other hand, crude oil futures have recently opened with gaps (marked with green). These call for the bears close them first before any sizable move to the downside.
Therefore, a downward reversal coupled with a test of the lower border of yesterday's gap (or even a drop to the middle gap) seems to be reasonable for starters. It could be followed by another attempt to move higher (maybe even to the above-mentioned 61.8% Fibonacci retracement and the orange resistance zone) that eventually gives way to a bigger correction. That currently seems to be the most likely scenario.
Summing up, the bulls have reached an important resistance and despite the ongoing and increasing bearish divergence in the CCI, they have retained a certain degree of control. While the oil market is set for a lower open today, one more upswing remains probable before any correction of recent sizable gains gets a chance to set in. As for now however, there's no opportunity worth acting upon in the oil arena.
