Heading off the beaten path just a bit today, into the exciting world of commodities. Specifically, soybeans. As a result of trade wars and tariffs, etc., more people are conscious of the fact that soybeans exist and are a tradable commodity than at most times in the past.
In a nutshell, the common perception is “if trade war news is good that is good for beans and vice versa.” And that is probably true. But many commodities have a personality of their own. With a commodity like soybeans it has a lot to do with the growing cycle in the U.S. Generally speaking, it goes like this:
- Early in the year: no beans are in the ground, uncertainty is high, prices tend to rise
- Spring: planting goes well, prices cool off OR planting does NOT go well and prices continue to rise
- Summer: By now it is apparent whether or not it is a good year or a bad year for beans, price tends to decline
- Late summer/harvest season: The game is over for this year; prices tend to decline (often sharply)
Today we will focus on “Late summer/harvest season”.
But first let’s take a look at the ‘Big Picture”.
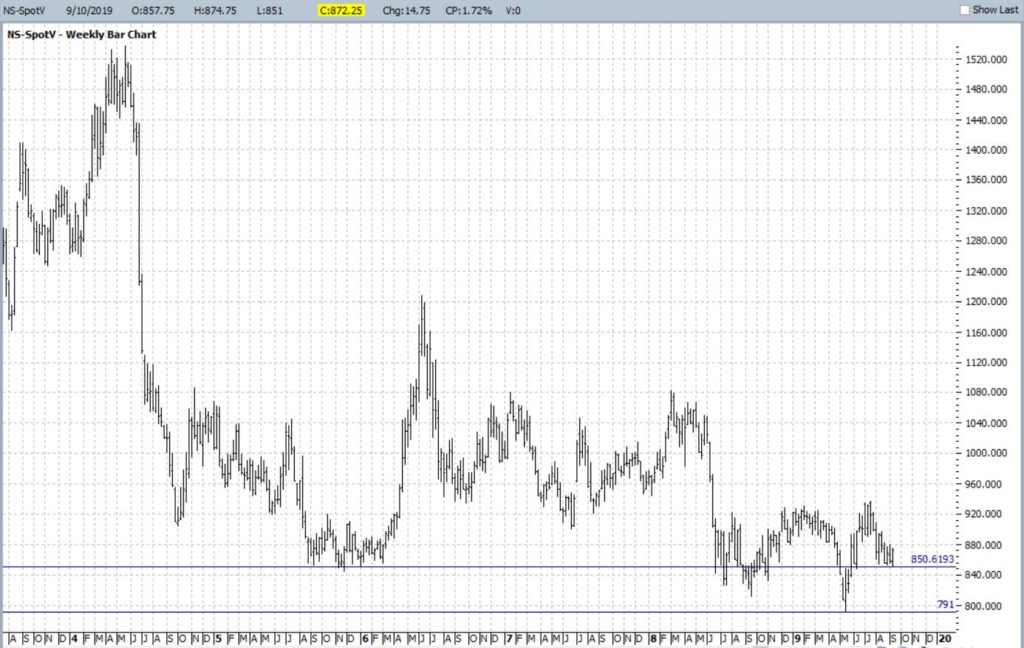
As we can see in Figure 1, soybeans have support in the 790 to 850 range (technically this means $7.90 a bushel to $8.50 a bushel).

(Courtesy ProfitSource by HUBB)
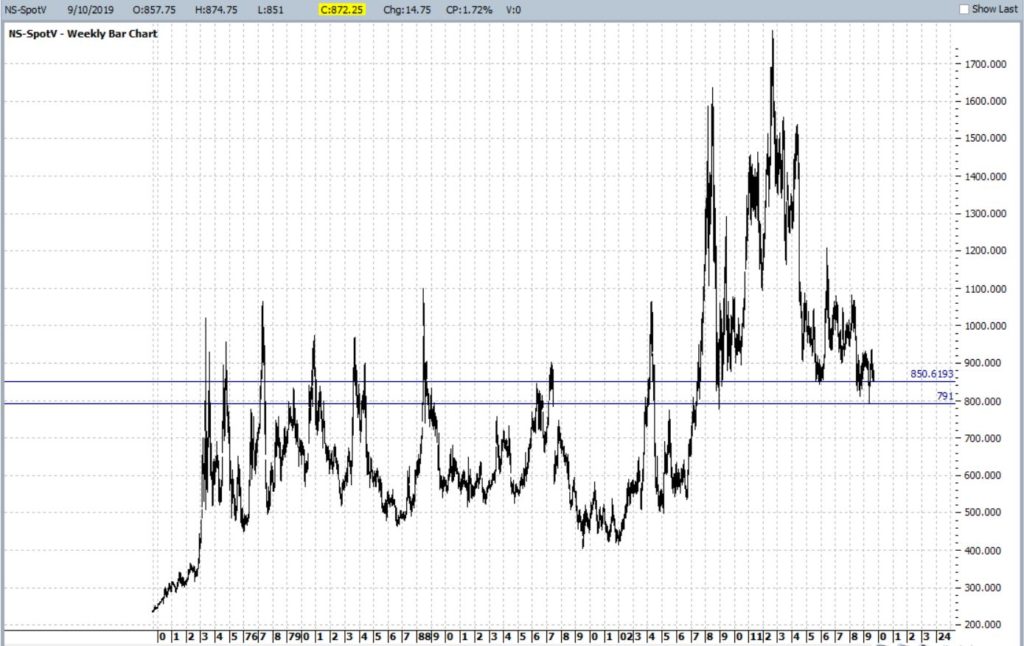
As we can see in Figure 2, this range was previously something of a “DMZ” for beans. Beans would spike up quickly through this range to the ultimate top and then collapse just as quickly back down through this range. Then after about 2007 beans spent most of their time north of this range, and several times it served as support – just as it is trying to do now.

(Courtesy ProfitSource by HUBB)
So like I said, if any perceived “good news” pops up regarding trade with China, beans would likely be expected to “pop” higher.
Um, but in the meantime….
Late Summer/Harvest Season
We will define this period as the end of September trading day #5 through the end of October Trading Day #2.
Now let’s consider the performance of soybean futures during this period from year-to-year. Each full $1 movement in the price of soybean futures contract (which entails 5,000 bushels of soybeans) is worth $5,000. Therefore, each 1-cent movement in the price of a soybean futures contract is worth $50.
Now let’s suppose that each and every year we bought one soybean futures contract at the close of the 5th trading day of September each year, and sold it at the close of the 2nd trading day of October.
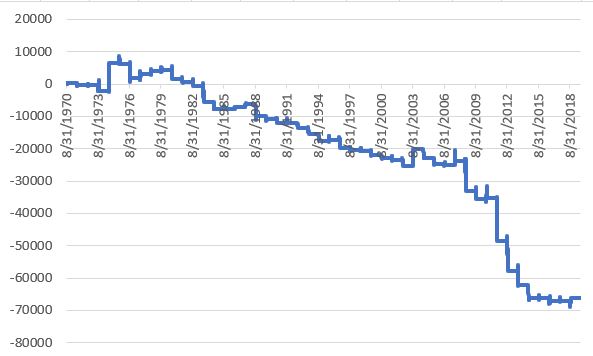
Figure 3 displays the cumulative performance of this particular(ly unfortunate) strategy.

Figure 3 – Cumulative +(-) from holding long 1 soybean futures contract from Sep Trading Day #5 through Oct Trading Day #2; 1970-2018
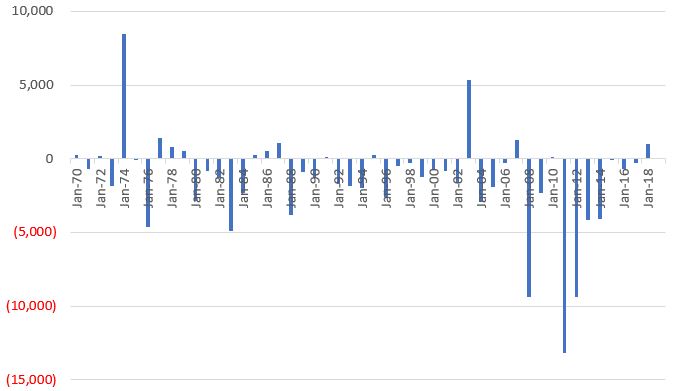
Figure 4 displays the year-by-year results

Figure 4 – $ +(-) for Soybean futures, long Sep Trading Day 5 through Oct Trading Day 2; 1970-2018
Finally, some fact and Figures:
*# times UP = 15 (30% of the time)
*# time DOWN = 34 (68% of the time)
*# times unchanged = 1
*Largest Gain = +$8,475 in 1974
*Largest Loss = (-$13,200 in 2011)
*Average Gain = +$1,436
*Average Loss = (-$2,582)
Here are the wrong things and the right things to take away from all of this:
*Most people look at Figure 1 and immediately think “there is no way beans are going up.” This is incorrect. Soybeans actually went up 30% of the time.
*Still, historically there has been roughly a 7 in 10 change of beans declining during this period
*Making matters worse is that the average loss was almost 1.8 time greater than the average win.
The Bottom Line
There is every chance that beans could advance between now and the close on 10/2.
But history suggests it is a bad bet.
