The TRON Foundation announced that it will be revamping BitTorrent Live.
BitTorrent Live was originally conceived as a television service…but this new iteration is designed as a social media application. The goal…is to create something competitive with Bytedance’s TikTok or SnapChat.
The BitTorrent Live has yet to be released, but it may help boost the price of both Tronix—the native cryptocurrency deployed on the TRON network—and BitTorrent Token (BTT).
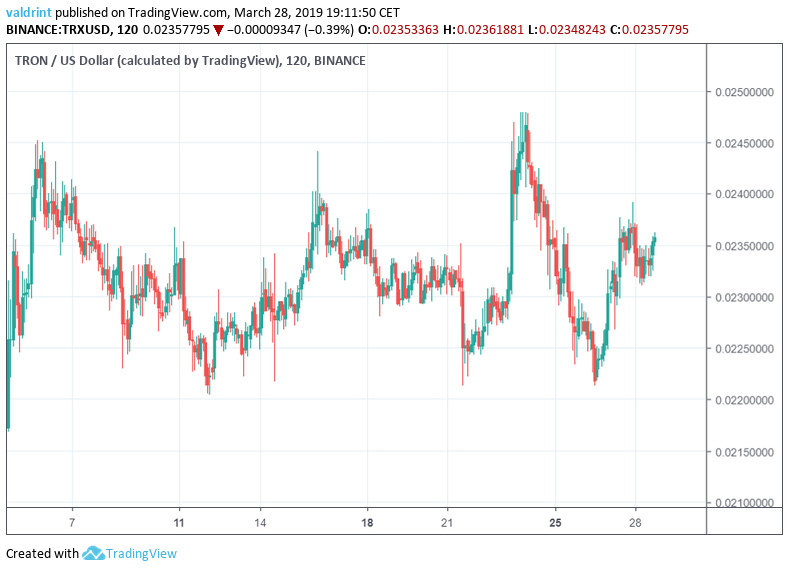
Currently, TRX is fluctuating between $0.025—a high reached on Mar 5—and $0.022—a low reached on Mar 12.
Tronix (TRX): Trends And Highlights For March 28, 2019
- The price of Tronix—often referred to as simply Tron—is trading inside a horizontal parallel channel.
- TRX is trading inside a longer-term symmetrical triangle
- There is bearish divergence developing in the RSI.
- The closest resistance area is found near $0.028.
- The closest support area is found near $0.019.
Horizontal Channel
We begin our analysis by defining Tron’s current trading pattern. We do this by analyzing the price of TRX on Binance at two-hour intervals from Mar 6 to Mar 28.
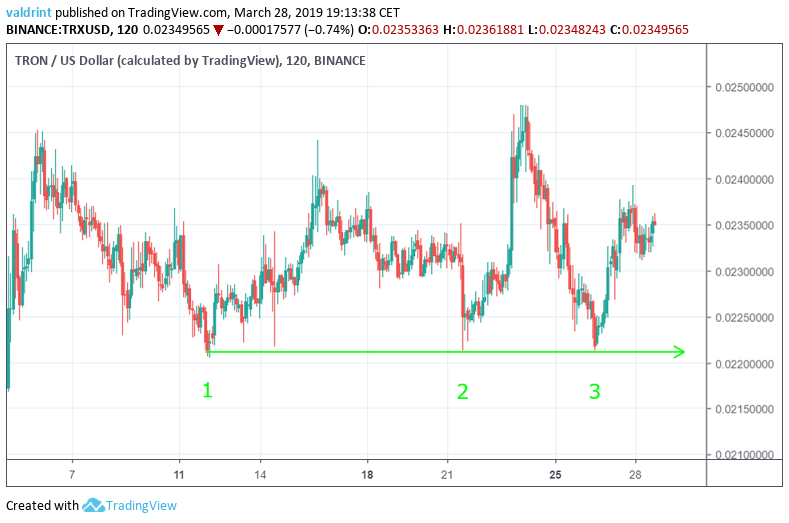
TRX made a low of $0.022 on Mar 12. A gradual increase ensued. A drop brought it back to the same level. A sharp increase followed before TRX dropped to the same level again.
Tracing these lows gives us a horizontal support line:
The price of Tron reached a high of $0.0245 on Mar 5. It has been reached three times since.
Tracing these highs gives us a horizontal resistance line. Furthermore, the resistance and support lines combine to create a horizontal channel:
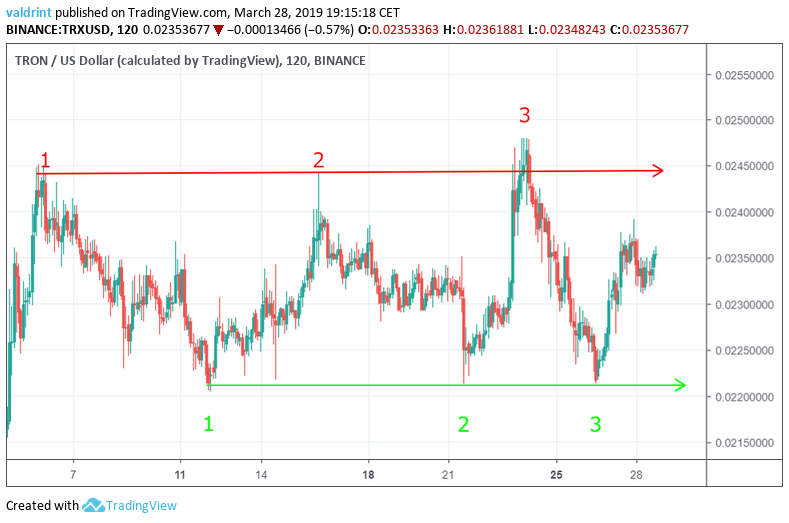
This channel is a generally neutral trading pattern. Price is expected to rise and fall between the support and resistance.
Bearish Divergence
To better determine the future movement of Tron, we analyze its price over at thirty intervals from Mar 26 to Mar 28 alongside the relative strength index (RSI).
About the RSI: The relative strength index (RSI) is an indicator which calculates the size of the changes in price in order to determine oversold or overbought conditions in the market. Combining RSI bullish/bearish divergence with support/resistance essentially predicts price fluctuations.
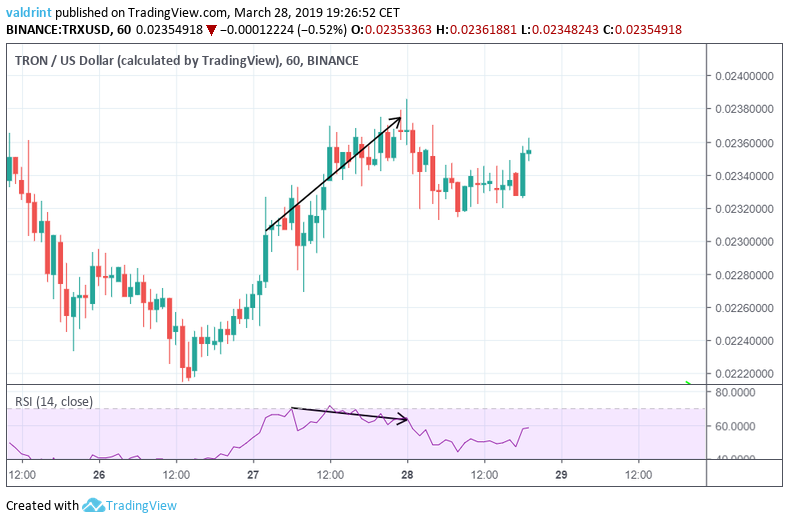
On Mar 27, the price made a high of $0.023. It has continued to make higher highs since.
Similarly, the RSI made the first high on Mar 27. However, it has generated lower values since.
This is known as bearish divergence and often precedes price decreases.
This suggests that TRX may drop toward the support line of the channel.
Reversal Areas And Summary Of Analysis
The price of TRX on Binance is analyzed at 12-hour intervals from Dec 1, 2018 to Mar 28, 2019 to determine possible resistance and support areas.
About Resistance and Support Areas: Resistance and support areas are formed when the price reaches a certain level several times. They can act as a ceiling/floor that prevents the price from moving further in that direction.
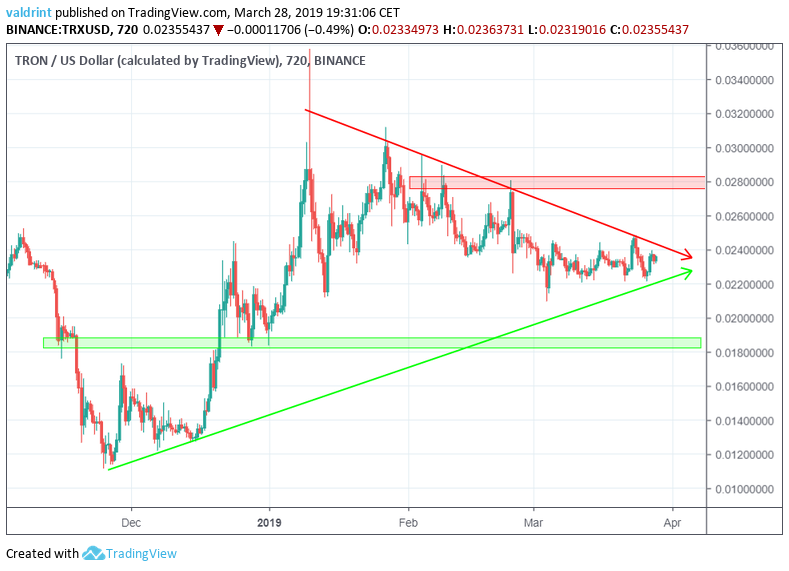
We can see that the price has been trading inside a symmetrical triangle since Nov 2018. Furthermore, TRX is very close to the point of convergence between support and resistance.
Therefore, a breakout or breakdown from the channel could also lead to a breakout or breakdown from the long-term symmetrical triangle.
In case a breakout occurs, the closest resistance area is found near $0.028. In case a breakdown occurs, the closest support area is found near $0.019.
Summary Of Analysis
Based on this analysis, it is likely that the price will drop to the support line of the short-term horizontal channel. In the long-term, we believe a breakout and a breakdown to be equally likely, therefore we are waiting for the market to develop more signals.
Do you think BitTorrent Live will help TRON break out of this channel? Let us know your thoughts in the comments below!
Disclaimer: This article is not trading advice and should not be construed as such. Always consult a trained financial professional before investing in cryptocurrencies, as the market is particularly volatile.
